In our previous post, we explored why MCP servers require a different approach to load testing. We’ve discussed bursty traffic patterns, the importance of reliability over raw latency, and the functional requirements for simulating real AI agent behaviour.
In this post, we’re going to walk you through the practical implementation using Grafana’s k6.
Setting up virtual users
Having identified k6 as our tool of choice, the first step is to configure ramping virtual users, which can be easily defined programmatically with JavaScript. In our case, we’re simulating 100 AI agents progressing through three distinct stages:
- Gradually increment the number of users during a 30-second period.
- Sustain the load for 30 seconds.
- Quickly and gracefully stop all virtual users within 10 seconds.
Code for this scenario is as follows:
export const options = {
  scenarios: {
    llm_spike_test: {
      executor: 'ramping-vus',
      startVUs: 0,
      stages: [
        { duration: '30s', target: 100 },
        { duration: '30s', target: 100 },
        { duration: '10s', target: 0 },
      ],
      gracefulStop: '5s',
    },
  },
};
Simulating random idle times
Now that our virtual users (simulated AI agents) are set up, we can simulate random idle times. These act as conversational gaps with spikes afterwards, representing the scenario where we wait for a large language model to decide which MCP tools to call in its “thinking phase”.
To implement these random gaps, we make each virtual user sleep randomly at the end of its call chain. For this task, we are going to use k6 utils:
import { randomIntBetween } from 'https://jslib.k6.io/k6-utils/1.2.0/index.js';

sleep(randomIntBetween(5, 10));| Adding MCP support to k6 By now you may wonder, “but there isn’t a stable MCP support for k6”, that’s true. This is the exact reason why we also like this tool; we’ve extended the k6 with MCP support, and the result was a xk6-infobip-mcp extension. A complete example of MCP load test can be found in this GitHub repo. |
After running our load test scenario, we got a chart of our load pattern where we can double-check if we got the pattern we wanted.
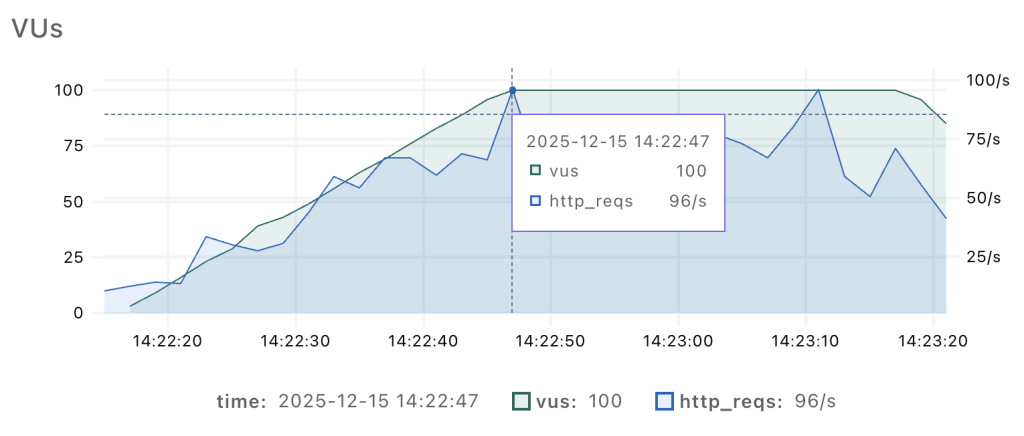
The graph shows how our simulated AI agents ramp up gradually, but with noticeable spikes in HTTP requests. I think we’re ready now to take a look at what the load test results reveal!
Load test results
Let’s analyse the outcomes produced by our testing approach to provide some insights into the impact of our load scenarios on system performance.
Grafana’s k6 allows you to view the result in multiple formats, and two of them are output in terminal and an HTML report.
For a quick developer-friendly view, I prefer the standard output (see the image below), but different views offer different advantages for interpreting results.
         /\      Grafana   /‾‾/
    /\  /  \     |\  __   /  /
   /  \/    \    | |/ /  /   ‾‾\
  /          \   |   (  |  (‾)  |
 / __________ \  |_|\_\  \_____/

     execution: local
        script: examples/mcp-sms.js
 web dashboard: http://127.0.0.1:5665
        output: -

     scenarios: (100.00%) 1 scenario, 100 max VUs, 1m15s max duration (incl. graceful stop):
              * llm_spike_test: Up to 100 looping VUs for 1m10s over 3 stages (gracefulRampDown: 30s, gracefulStop: 5s)


  █ TOTAL RESULTS

    checks_total.......: 1313    17.480365/s
    checks_succeeded...: 100.00% 1313 out of 1313
    checks_failed......: 0.00%   0 out of 1313

    ✓ result is not empty

    CUSTOM
    mcp_call_duration....: avg=127.03ms min=70.44ms med=121.16ms max=340.11ms p(90)=161.7ms p(95)=176.8ms
    mcp_calls............: 1317    17.533618/s
    mcp_errors...........: 0.00%   0 out of 1317
    mcp_success..........: 100.00% 1317 out of 1317

    HTTP
    http_req_duration....: avg=104.23ms min=55.38ms med=98.01ms  max=1.08s    p(90)=141.8ms p(95)=157.12ms
    http_req_failed......: 0.00%   0 out of 3950
    http_reqs............: 3950    52.587541/s

    EXECUTION
    iteration_duration...: avg=8.23s    min=5.47s   med=8.57s    max=10.95s   p(90)=10.59s  p(95)=10.65s
    iterations...........: 652     8.680273/s
    vus..................: 8       min=4            max=100
    vus_max..............: 100     min=100          max=100

    NETWORK
    data_received........: 24 MB   319 kB/s
    data_sent............: 8.1 MB  108 kB/s


running (1m15.1s), 000/100 VUs, 652 complete and 8 interrupted iterations
llm_spike_test ✓ [======================================] 005/100 VUs  1m10s
From Simulated Load Patterns to Actionable Insights
The output depicted above shows how one MCP call results in multiple HTTP requests. In our case ~17 MCP requests per second resulted in ~52 HTTP requests per second. This significant difference clearly stresses the importance of measuring MCP calls, not just HTTP ones.
Unlike the terminal output, the HTML report enables us to efficiently correlate between potential service degradations occurring during peak load events and underlying factors such as network bandwidth constraints.
For example, if we had a bandwidth issue, the data transfer rate would plateau at a certain maximum and not exceed that level. However, if you look at the image below, that’s not what we’re seeing.
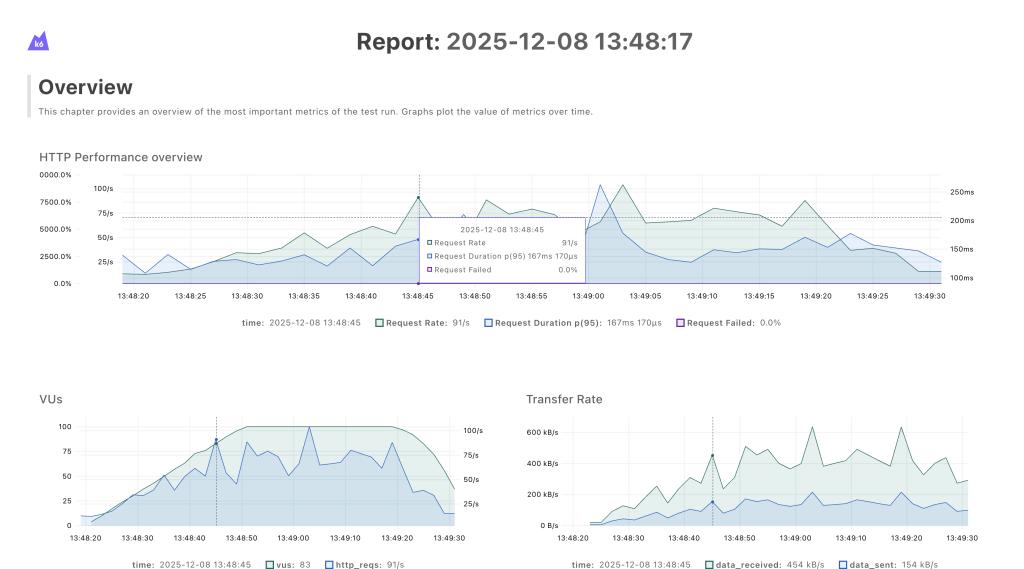
The data transfer rate continues to climb together with the increased load, rather than flattening out. This suggests that, at least in this scenario, bandwidth is not the limiting factor.
By analyzing results from different reports, we were able to identify key performance issues like sudden spikes in duration and errors that could indicate timeouts. The reports gave us grunt work for identifying key areas of improvement.
How did load testing help us improve stability?
Load testing underlined some issues we wouldn’t have caught otherwise. Let me show you in more detail how the results of our load testing provided practical guidance for improving the reliability and stability of our system.
Timeouts
As mentioned before, load testing showed us some strange behavior that we couldn’t link to processing issues.
By digging deeper, we have seen timeout errors on balancers, but our MCP processing was successful. This indicated that balancers needed bigger timeout values than we had on our longest processing MCP tool. To address this issue, we’ve implemented a cascading timeout strategy.
We configured the public load balancer with the longest timeout duration, while keeping the internal MCP server processing time the shortest. We figured it would make the connection stay open long enough for the server to complete its task.
Latency and sticky sessions
Our next issue to tackle was with latency. We’ve noticed that traffic shifted too rapidly between instances based on load. This caused even bigger latencies and broken Server-Side Events. To solve the instance hopping, we’ve introduced sticky sessions.
Sticky sessions significantly reduced latency by allowing the same AI agent to reuse its session state, which is stored as “warm” data in the server’s fast in-memory cache (RAM). We needed a mechanism to direct subsequent requests to the same server, and we considered two options: route traffic by MCP Session ID header or by the client IP address.
The MCP protocol is relatively new and industry adoption of its latest features is inconsistent. To support the latest features and ensure backward compatibility for existing AI agents built on older versions, we’ve implemented both the Session ID and the IP address strategies for achieving server “stickiness.”
This shows us how much value even a simple load test can bring in terms of not only capacity planning but also identifying state issues in high-concurrent systems.
What is next?
Although we’ve already had a lot of data to go on, we are not done with expanding load testing capabilities to cover interesting cases like:
- Reducing MCP call errors of load-balanced deployments by using the new k6 disruptor extension and applying self-healing in cases of a datacenter outage
- Integrating a mechanism in the error handling workflow that translates the volume of MCP output data into a precise LLM token count metric to minimise cost of wasted tokens
Prevention is always better than cure, by battle-testing our infrastructure we can relaxed look forward to holidays and let AI agents worry and think.
Wrapping Up
Implementing MCP load tests with k6 gave us both the flexibility we needed and actionable insights we didn’t expect. We simulated realistic agent behavior by adding random idle times to our virtual users. The results showed us that one MCP call can generate multiple HTTP requests. With that in mind, we could conclude that measuring performance at the MCP level is the only way to get the full picture.
More importantly, load testing surfaced hidden issues like timeout misconfigurations, instance-hopping, broken SSE connections that functional testing would never have caught.
We’ve shared the xk6-infobip-mcp extension on GitHub in case it’s useful to others facing similar challenges. If you’re running MCP infrastructure at scale, we encourage you to try it out and contribute back.
Load testing isn’t just about capacity planning; it’s about understanding how your system behaves under stress and fixing problems before your users encounter them.