It sounds like the beginning of a joke, but it’s not. The answer, as per our experience, is 5. Here is how to plan, implement, and document your own monitoring solution to make that possible.
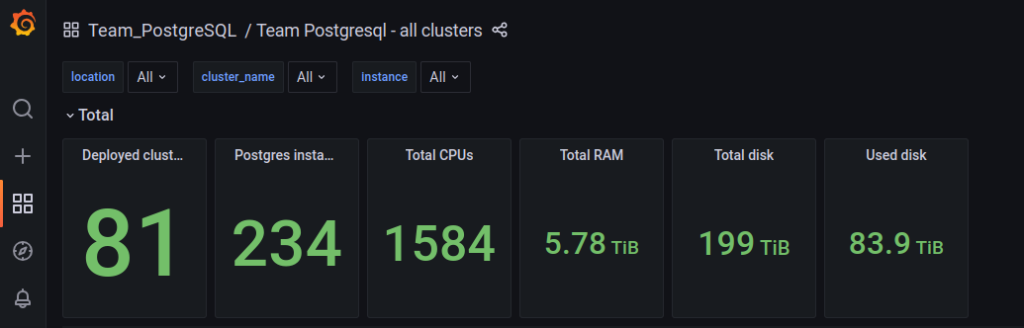
Before we start with the technicalities, let me explain why this topic has an essential role in any company, regardless of its size. Infobip, where I work, is one of the biggest telecommunication companies in the CPaaS domain, where we maintain over 200 DB instances with PostgreSQL flavor deployed.
We were lucky enough to be a newly formed team in the company, so we had a chance to create our monitoring solution from scratch and set the way we wanted to maintain our clusters.
It is a daunting task, but it carries a huge reward as well. Not to mention that it is always easier to make changes and modifications to a system you have created and know well, in comparison to updating a legacy system. I can confirm that from my personal experience – in one of my previous jobs, we inherited a monitoring solution, and it wiped the smile from my face for a couple of months.
Setting it up
Now, let’s start with the fun part.
We have our own internal tool for deployment where every service (DB, ETCD, PgBackrest, exporters) is installed as a docker container. So, in order to collect metrics and statistics from the DB, we are deploying Postgres Exporter on the same VM where the DB is deployed (we are doing the same for ETCD with its respective metrics proxy). This is from our side.
On the other hand, Prometheus is available on the Infobip infrastructure platform. Prometheus components are:
- Prometheus Server – component for scraping metrics from configured targets
- Prometheus Pushgateway – component for pushing metrics to Prometheus
- Prometheus Alertmanager – component for routing and sending alerts
- Grafana – UI for visualising data from Prometheus Server
- Prometheus Agent – service for reconfiguring Prometheus Server and Alertmanager
Prometheus Server and Alertmanager are configured via Git repository, so any change pushed to branch master will be applied on Prometheus Server or Alertmanager within a minute.
Metrics scraping is configured with scraping jobs, which are configured in the prometheus.yml file.
In other words, we have such a great infrastructure team that we have only one responsibility: make our metrics available for a Prometheus server to scrape. This is done by exposing an HTTP endpoint, usually /metrics, which returns the complete list of metrics (with label sets) and their values. This endpoint should be very cheap to call as it simply should output the current value of each metric without doing any calculation.
Alerting with Prometheus is separated into two parts. Alerting rules in Prometheus servers send alerts to Alertmanager. The Alertmanager then manages those alerts, including silencing, inhibition, aggregation and sending out notifications via methods such as email, on-call notification systems, and chat platforms.
The main steps to setting up alerting and notifications are:
- Setup and configure the Alertmanager
- Configure Prometheus to talk to the Alertmanager
- Create alerting rules in Prometheus
Our exporter has its own SQL queries in its Bitbucket repository that it executes on the respective DB.
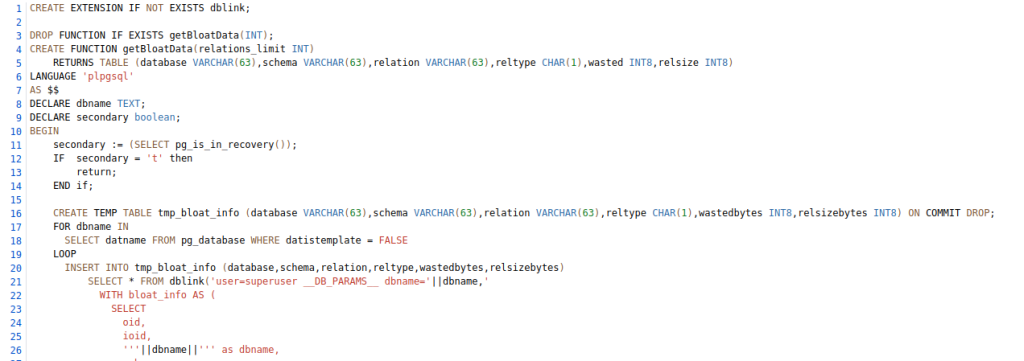
We have separated bigger queries (e.g., for bloat) into their own .sql files, while the majority of the queries remain in the same file.
Part of the query for monitoring bloat:
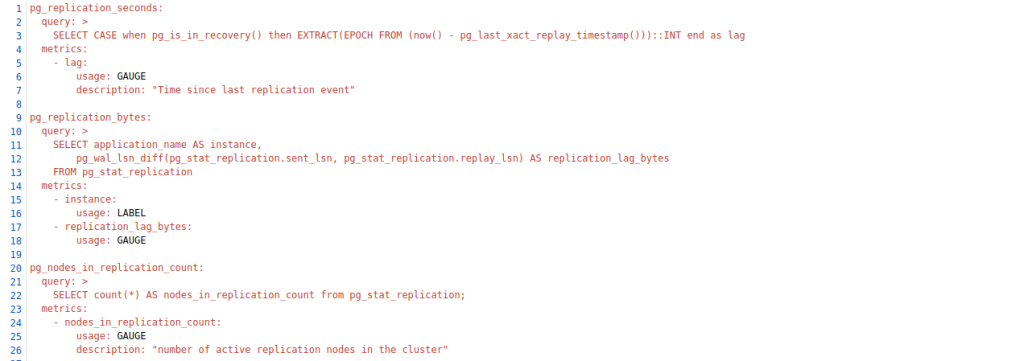
Smaller queries:
Final words of wisdom
There is one thing I would like to emphasize: Write extensive documentation during the implementation of the monitoring solution. I know this is not the first time you’ve read that the documentation is important, but tell me this – are you brave enough to deploy to production without having a monitoring set? Feeling lucky?
If you have detailed documentation, implementation for you, and most importantly, for the people who come after you, it will be golden. I have already mentioned my experience with inheriting a monitoring solution and what it can do to a person. This way, there will be no question marks with the newbies.
When everything is said and done, I leave you no choice but to implement a great monitoring solution.
Our way is just one of the paths you can go – I am not here to brag about what great monitoring we have. It is rather to raise awareness of the importance of the monitoring solution and its quality.
For us, DBAs, data is our bread and butter, and its consistency is the most important thing. Because of that, monitoring DBs is a crucial part of preventing issues in production. And even if they happen, being able to check and compare past data during troubleshooting makes all the difference.