Moments
If you are looking for options related to analytics available in Moments, you are in the right place. The paragraphs below are meant to give you a clear picture of our latest features: how to perform an audience segmentation based on its behavior, which metrics are currently available for this, and more.
Events Segmentation Analytics
This most basic kind of event analytics serves to allow users a better insight into their audience. Events Segmentation analytics has three core modules:
- Selecting segments
- Selecting events to show
- Events data visualization
Select Segments
Behavior data will help you better understand how your audience interacts with an app or a website. The audience segmentation lets you dig a little deeper and see the difference in that behavior.
These segments can be based on people attributes - static data related to each person whose information you have stored in the Target module. It usually involves some very current information and is very likely to change in the future.
In Segments, you can use standard person attributes or custom attributes that you have defined and populated yourself in the Target module.
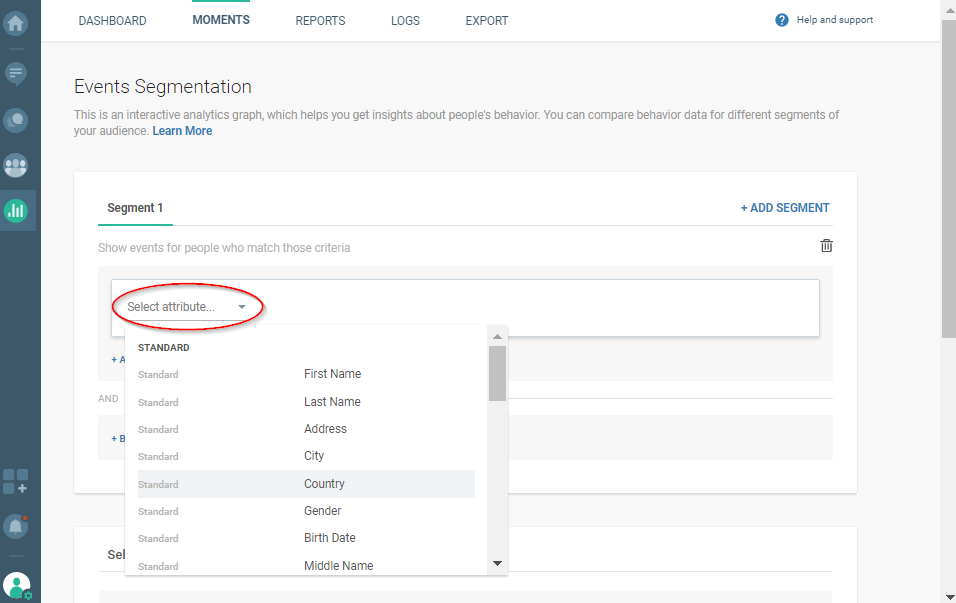
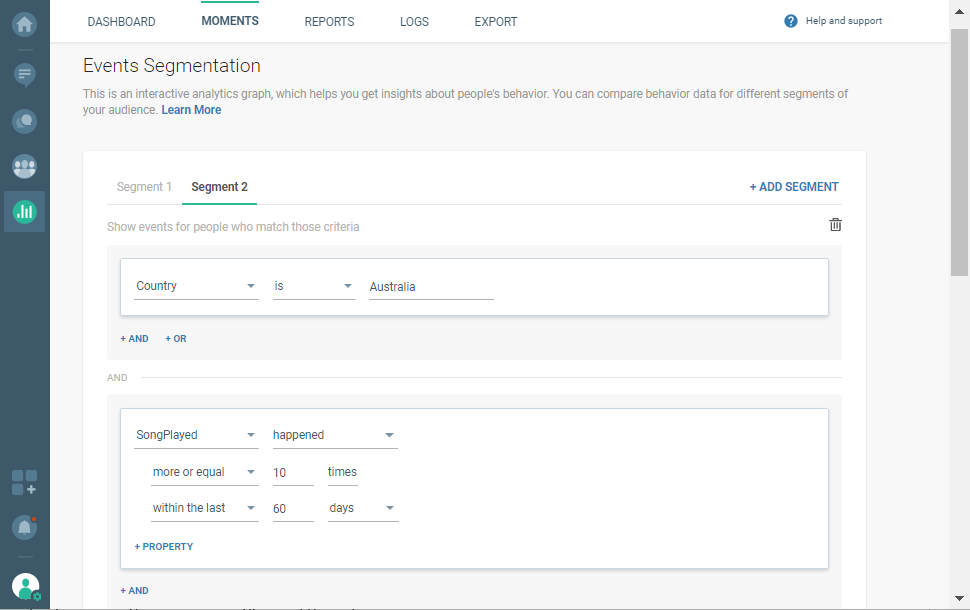
Up to 4 segments can be created in the Event Segmentation analytics. The image below displays a basic 2-segment scenario.
Select Events To Be Shown
Events reflect user actions inside an app or on a website. Events Segmentation analytics can display up to 4 different events on the user activity graph.
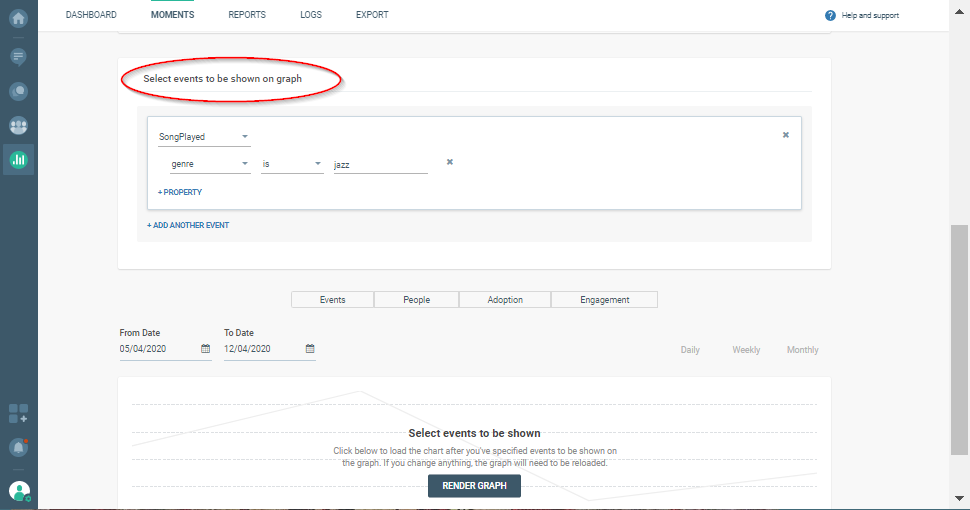
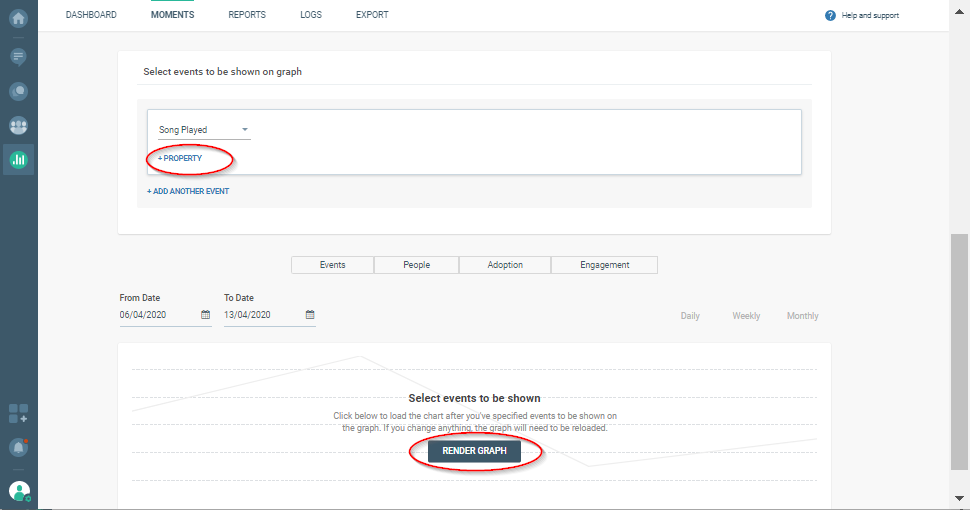
On the Events Segmentation page, scroll down to Select events to be shown on graphand decide which events you want to include.
Events Data Visualisation
Click the +property link to set the event properties. In addition to a specific event on the graph, when you include properties you will also see certain conditions that have been met. Take a music streaming app as an example: if you select the Song Played event only, the graph will show how many people listened to the songs. If you select Song Playedwith jazzas a *songGenre,*the graph will show how many times people listened to jazz songs.
The data related to the event will be shown as a line graph chart. When you’re done specifying segments and events that should appear on the graph, click RENDER GRAPH.
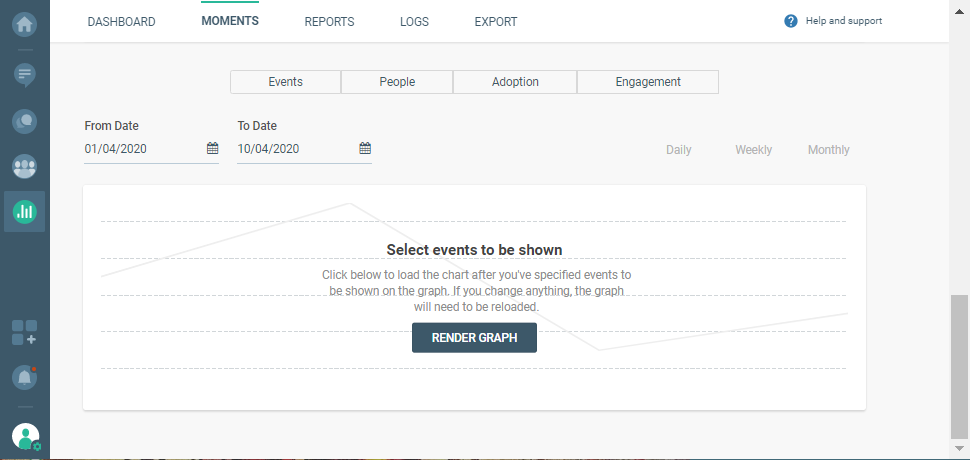
Remember to select a time period that you would like visualized on the graph (you can modify this later if you need to). Choose the last 7 days, last 30 days, this week, previous week, or a custom range that you define yourself. You can also get information for different periods within your set timeframe. For example, if you need a weekly graph, but also want to see daily data, select dailytoo.
Metrics
Four metric types are currently available on the Events Segmentation page:
- Events
- People
- Adoption
- Engagement
Events metrics show the number of selected events that happened on a specific date. You will get a better idea of whether the users` amount of activity aligns with the goals you have set for your product.
To understand how many people performed specific actions within different time frames, you should turn to the People metric.
The Adoption metric reveals whether certain parts of the app’s functionality are being used by your audience or a specific audience segment. Keep in mind that the best practice would be to set up a segment of people based on the registration date. You can select a segment of people who registered in May and then check out the report for Adoption related to the months following the registration and to the most important features that you have. If you are going to use the Adoption metric without a registration-based segment, you may get incorrect information because the audience will include new users who were not able to perform any actions before they registered!
The Engagement metric helps you understand how many actions are generated by one person on average. If you are trying to inspire the audience to perform many actions during the day, this report will uncover whether there is a growth or decline in engagement. As with the Adoption metric, you will need to select a segment of people based on the registration date. Otherwise, calculations will include 'new' users who simply could not have performed any actions before the registration!
Funnel Analytics
A sequence of user actions on your website or mobile app tracked with Funnel Analytics will show you how different audience segments behave so you can better adapt your engagement strategy.
Let`s take user activation as an example. Activation often means that a customer goes through a number of steps before realizing that a specific product is something they need. The ultimate goal of marketing teams is to encourage more customers to reach that realization and complete the funnel. Before you are ready to analyze the funnel data and adapt campaigns accordingly, you will need to have the customer information stored inside the Infobip People module and be able to track events.
Next, in the Analyze module on our web interface, you should select the Moments and do the following:
- set up an audience segment or use the whole audience
- select the sequence of events that represent your funnel
- specify conversion window (the adequate timeframe for the funnel)
- specify the timeframe for funnel calculation
We will quickly go through each step, and then you can go ahead and start analyzing and adapting your strategy!
Segments
Calculate a funnel either for all the people you have or for certain audience segments. Up to 2 segments can be used in funnel analytics. To specify the segment, select the existing standard attribute (such as country, city, etc.) or create a custom one.
Segments are helpful if you believe that certain groups of your audience might be completing the funnels differently. If that`s the case, you will need to figure out the reasons and how to make your ‘lower performing’ users convert at the same rate.

Events in a Funnel
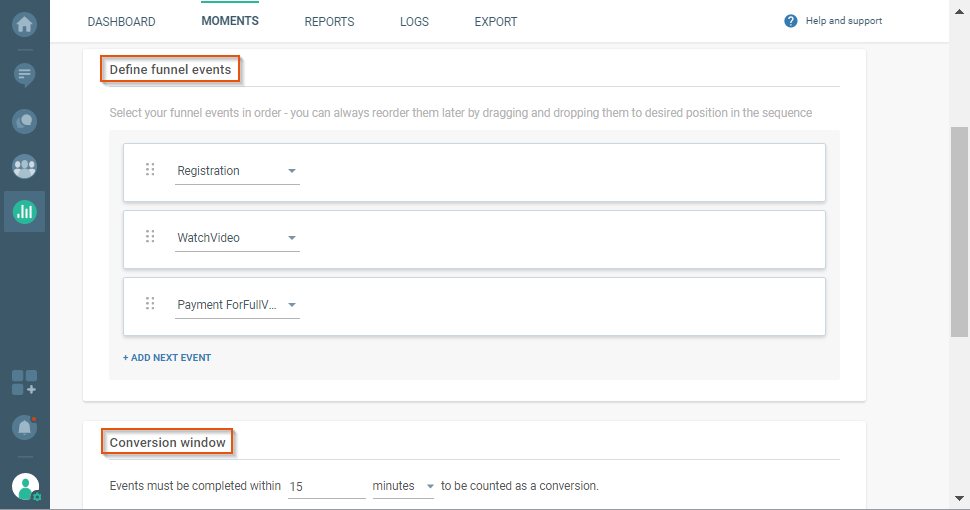
The next step is to define the funnel. Think about what sequence of user events has to happen for the funnel to be completed. This order of events is important, and it can`t involve any ‘optional’ in-between steps. Keep in mind that you can include up to 7 events in one sequence.
Imagine an example case with the user registration as the starting event and consider a possible timeframe for the entire sequence: Registration - 12:05pm; Watch video - 12:10pm; Payment for full video - 12:30pm.
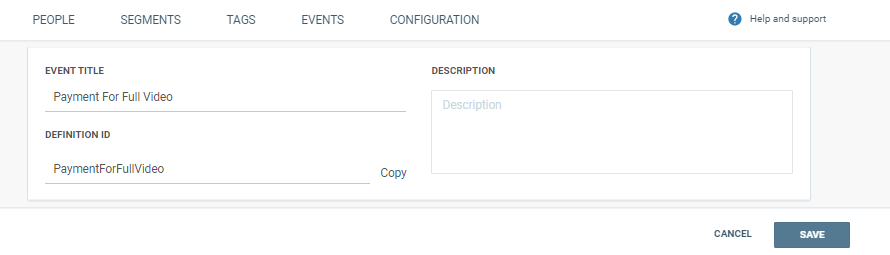
The screenshot below shows how to set up events that you will include in the funnel.
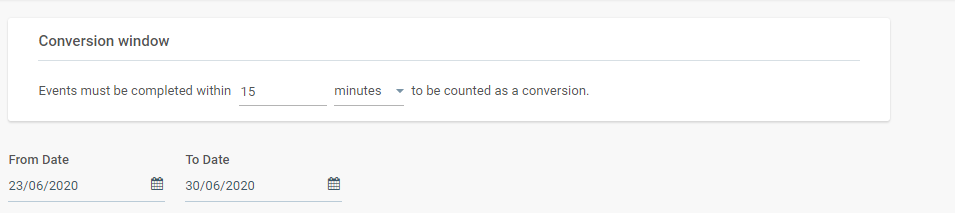
Conversion Window
Define an approximate amount of time that will pass between the first and last step in the funnel. For example, you can set the conversion window to 15 minutes, as we just did for the Registration- Watch Video - Payment for Full Video sequence.
If all the steps are not completed within 15 minutes, the funnel will show a drop-off.
Calculating the Funnel
To record one unique person within a given timeframe and a given conversion window, the whole funnel should happen. If it happens successfully at least once without drop-offs, then for that person the funnel is marked as complete. If that person enters the funnel multiple times but has at least 1 complete funnel, this still counts as a success and all other entries will be disregarded.
Funnel Graph
Pick a specific timeframe for the funnel calculation. But consider the fact that your app/website evolves constantly and the same is true for your acquisition efforts and communications strategy. That also means that the behavioral pattern of your users from six months ago may not match the present one.
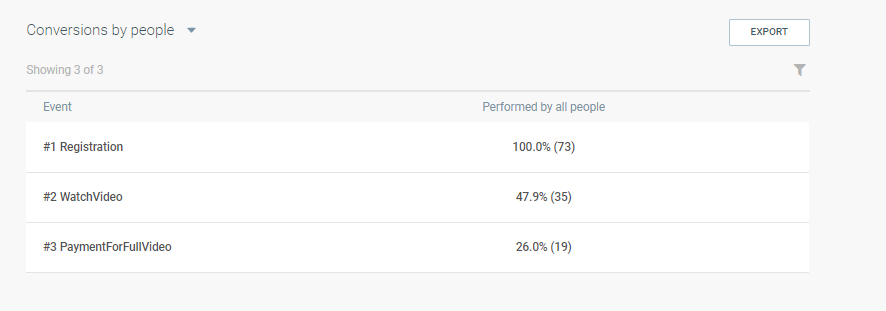
The resulting graph will reflect the funnel that you have specified. The number on top of the bar represents the number of people that have arrived at each specific step from the previous one.
Hover over the bars to see the percentage of people that reached one of the steps and the percentage of people who dropped off from the previous step, as well as the exact numbers for both.
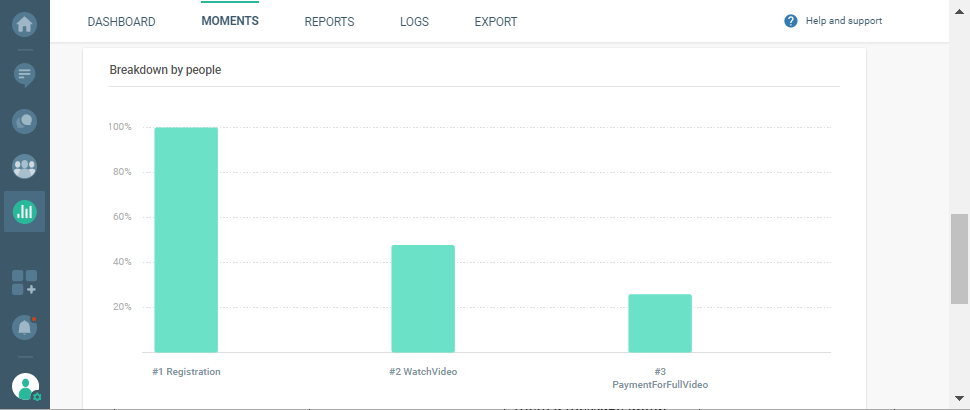
Table View
The information from the graph can be shown in the table view as well. There, you will find both exact numbers and percentages. The values in the segment columns show the number of people that arrived at the specific step from the previous one.