Broadcast campaign analytics
Broadcast analytics provides a unified view of campaign performance. It is powered by the Metrics API and powered by the Analyze dashboard to provide consistent, accurate, and actionable insights across all supported channels.
Legacy accounts will not receive these updates. Historical data may differ slightly due to the introduction of a new metric calculation model.
Overview
Use Broadcast analytics to track and evaluate campaign performance across channels. The unified data foundation ensures accurate delivery and engagement metrics, helping you make informed decisions before and after campaign launch.
Features
- Unified data foundation based on Metrics API
- Channel-specific analytics tabs for SMS, MMS, RCS, OTT channels (WhatsApp, Viber, Kakao, Zalo), Email, and Voice
- Improved delivery and engagement metric accuracy
- Clearer separation between estimated and actual traffic
- Enhanced user experience for both pre-launch and post-launch analysis
Data retention
The availability of analytics depends on data retention policies:
- Broadcast summary analytics (basic metrics on the campaign summary page) remain available for all campaigns.
- Detailed analytics (including metrics such as Sent, Pending, Delivered, Delivery rate) are retained for up to 12 months.
After 12 months, detailed analytics are no longer available. Export campaign reports regularly if you need to keep long-term records.
Broadcast summary
The Broadcast summary is displayed in the left-side panel of your campaign setup and preview screen. It provides key metrics about the campaigns before and after launch, including the cost breakdown.
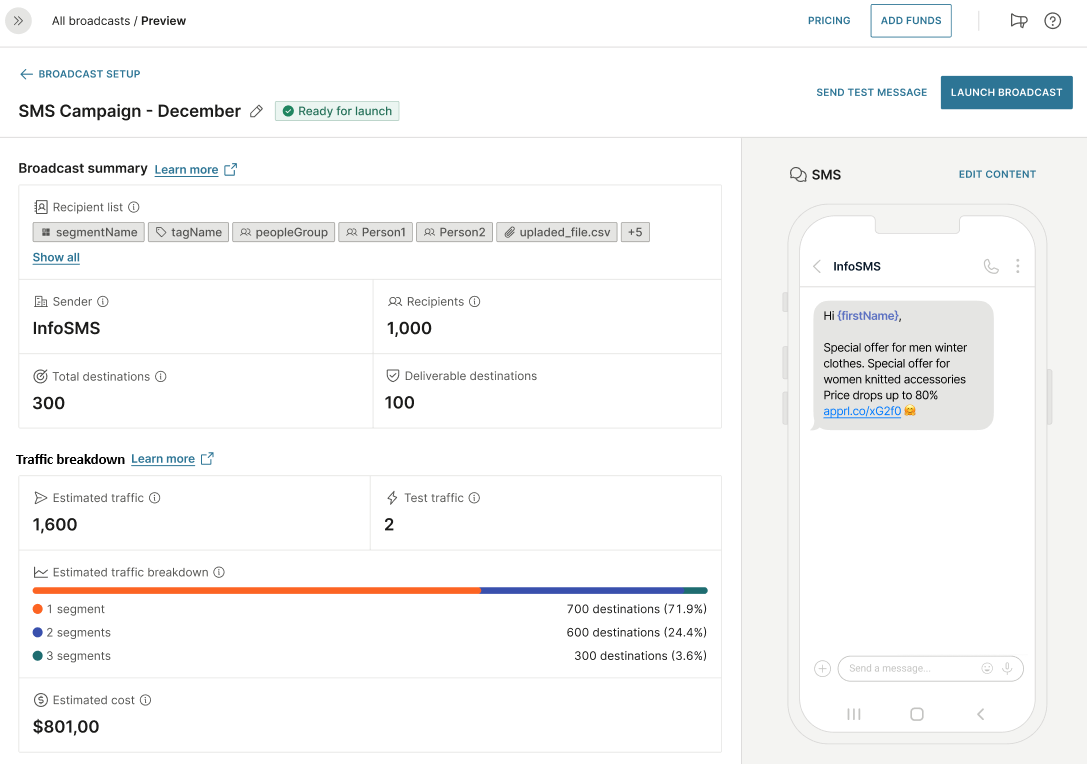
Pre-launch summary view
Before you launch a campaign, the Broadcast summary section provides an overview of key message delivery details. It helps you verify your recipient selection, destination breakdown, and expected traffic volume.
| Metrics | Description | Applicable channels |
|---|---|---|
| Recipient list | Selected audience sources (segments, tags, manual input, file upload). | All channels |
| Recipients | The number of unique, validated end users included in the campaign. | All channels |
| Total destinations | All targeted addresses or numbers, including duplicates (a recipient can have one or more destinations if using People). | All channels |
| Deliverable destinations | The number of valid and deduplicated destinations, post-validation. If a destination is targeted multiple times with different content, each is counted separately. | All channels |
| Messages skipped | Messages excluded due to unresolved placeholder or invalid destinations. |
Post-launch analytics summary view
After launching the campaign, the Analytics summary section displays real-time delivery data. Metrics vary depending on the selected channel.
| Metrics | Description | Applicable channels |
|---|---|---|
| Accepted | Total number of messages that were accepted by the delivery platform. Calculated by combining dropped, delivered, bounced, retried, and pending emails. | |
| Sent | Total number of messages submitted for delivery. Includes segment-level messages and test sends. Calculated by subtracting the number of dropped messages from the number of accepted messages.
|
|
| Attempted | Total number of outbound calls initiated by the system. |
|
| Pending | Messages that were handed off to the provider or platform but have not yet been delivered to the recipient. |
|
| Delivered | Messages that were successfully delivered to the recipient. |
|
| Answered | Total number of calls that were successfully answered by the recipient. Only includes business-initiated calls. |
|
| Delivery rate | The percentage of messages delivered to recipients. Calculated by dividing the number of delivered messages by the number of messages sent.
|
|
| Answer seizure rate | The percentage of seized calls (calls that rang) that were successfully answered. |
|
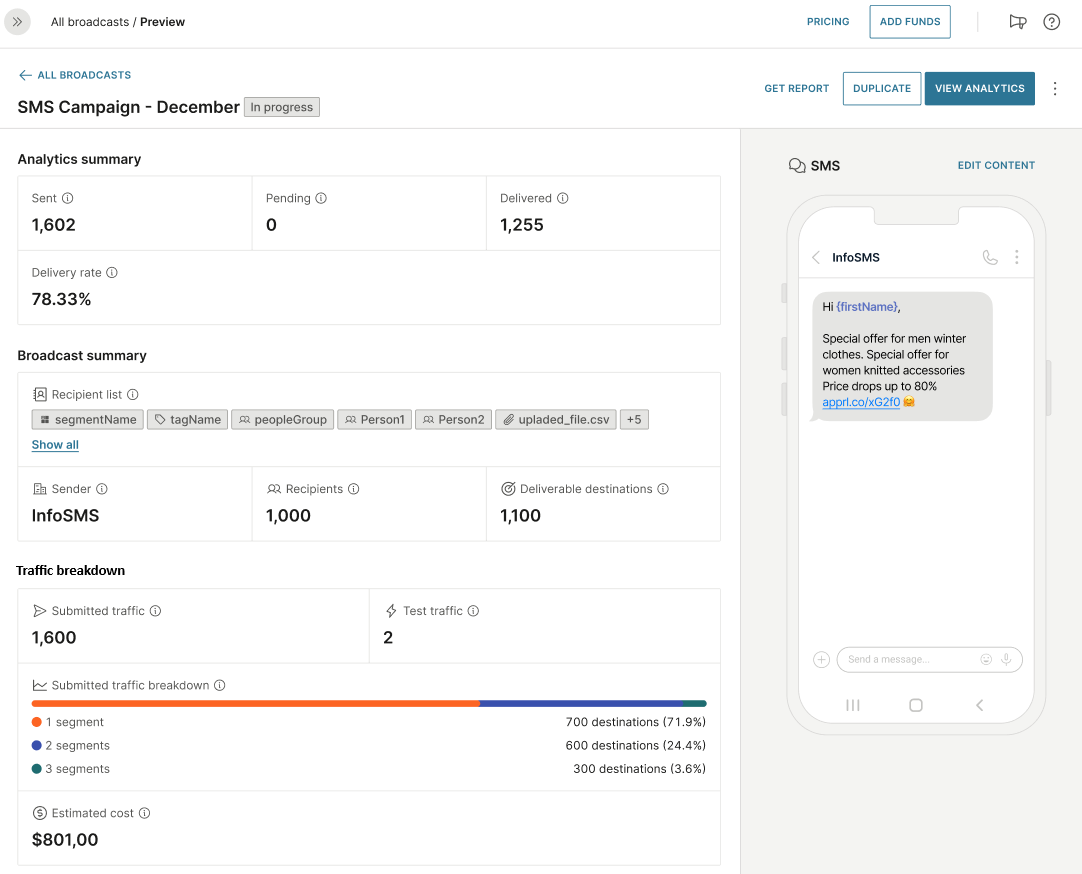
Traffic breakdown
This section includes projected traffic volume, test traffic, submitted messages, and, where supported by the channel, estimated costs.
| Metrics | Description |
|---|---|
| Estimated traffic | The number of outbound messages or calls expected to be sent based on validated recipients before the campaign is launched. |
| Submitted traffic | Total number of outbound messages or calls handed off to the delivery system after the campaign is launched. |
| Test traffic | The number of test messages sent to preview the campaign before launch. |
| Estimated cost | Projected campaign cost, rounded to two decimal places. The final cost may vary based on message validity period, pricing model, or failover configuration. |
Delivery and performance analytics
After launch, you can view real-time delivery and performance statistics in redesigned analytics tabs. The available metrics vary by channel.
SMS/MMS/RCS/OTT channels
Delivery analytics
On the Delivery tab, you can view core delivery metrics and breakdowns by country and network.
| Delivery metrics | Description |
|---|---|
| Deliverable destinations | The number of valid and deduplicated destinations, post-validation. If a destination is targeted multiple times with different content, each is counted separately. |
| Delivered | Messages that were successfully delivered to the recipient. |
| Delivery rate | The percentage of messages delivered to recipients. Calculated by dividing the number of delivered messages by the number of messages sent. |
| Estimated cost | Projected campaign cost, rounded to two decimal places. The final cost may vary based on message validity period, pricing model, or failover configuration. |
Additional charts
The following charts are also available:
| Chart | Description |
|---|---|
| Total sent traffic by status | Number of submitted messages (outbound), grouped by delivery status.
|
| Total sent traffic by country | Top five items displayed. Number of submitted messages, grouped by status and country. |
| Total sent traffic by network | Top five items displayed. Number of submitted messages, grouped by status and mobile operator. |
If the campaign includes failover, an additional grouping by channel is shown (first by status, then by channel).
Performance analytics
The Performance tab provides detailed engagement metrics for delivered messages, including visibility (Seen or Open) and URL interaction. The availability of metrics depends on the channel and the campaign's tracking configuration.
Click metrics are available only if URL click tracking is enabled in the campaign settings.
Open metrics are available only if email open tracking is enabled in the campaign settings.
| Metrics | Description | Applicable channels |
|---|---|---|
| Seen/Open | Number of messages that were marked as seen or opened by unique recipients. Each recipient is counted only once, regardless of how many times they viewed the message. Seen tracking may be affected by privacy settings, such as disabled read receipts. |
|
| Seen/Open rate | Percentage of delivered messages that were seen or opened by unique recipients. Seen rate tracking may be affected by privacy settings, such as disabled read receipts. |
|
| Total clicks | Total number of times any URL in the message was clicked. Includes repeated clicks on the same link. For example, if a message contains three links and each is clicked twice, the total clicks count is six. |
|
| Click rate | The percentage of total clicks relative to delivered messages. Calculated by dividing the total clicks with the number of delivered messages. This value can exceed 100% if recipients click multiple links or click the same link more than once. |
|
| Unique clicks | The number of unique recipients who clicked at least one link in the message. Each recipient is counted only one, regardless of how many links they clicked. |
|
| Unique click-through-rate (CTR) | The percentage of unique recipients who clicked on a link compared to the total number of messages delivered. Each recipient is counted only once, regardless of how many times or on how many links they clicked. |
|
| Unique clicked URLs | The number of distinct URLs that were clicked at least once within a message. Multiple clicks on the same URL do not increase this count. |
|
Additional charts
The following charts are also available:
| Chart | Description | Requirements |
|---|---|---|
| Seens vs total clicks vs unique clicks | Shows how many recipients viewed the message compared to how many clicked links, and how many were unique clickers. | - |
| Total clicks vs unique clicks by URL | Displays total and unique clicks for the most-clicked URLs in the message (top five items displayed). Visible only if click tracking was enabled and the campaign had URLs. | Click tracking |
| Seen rate vs click rate vs unique CTR vs delivery rate | Compares key percentage-based metrics to assess message performance across visibility, engagement, and delivery. | - |
Delivery analytics
On the Delivery tab, you can view real-time email delivery metrics, including delivery status and bounce rates. These metrics reflect how many emails were accepted, delivered, or rejected by the recipient's mail server.
| Metrics | Description |
|---|---|
| Deliverable destinations | The number of valid and deduplicated destinations, post-validation. If a destination is targeted multiple times with different content, each is counted separately. |
| Delivered | The number of messages that were successfully delivered to recipients. |
| Delivery rate | The percentage of messages delivered to recipients. Calculated by dividing the number of delivered messages by the number of messages sent. |
| Bounce rate | The percentage of messages that were not delivered due to soft or hard bounces. Calculated by dividing the sum of softs bounce and hard bounces by the total number of sent messages. |
| Dropped rate | The percentage of messages dropped before delivery. Calculated by dividing the number of dropped messages by the number of accepted messages. |
| Estimated cost | Projected campaign cost. |
Additional charts
The following chart is also available:
- Total sent by status: Shows the number of messages sent, grouped by delivery status.
Performance analytics
On the Performance tab, you can view email engagement metrics such as opens, clicks, and click-through rates. These metrics help you understand how recipients interacted with your message after it was delivered.
Click metrics are available only if URL click tracking is enabled in the campaign settings.
Open metrics are available only if email open tracking is enabled in the campaign settings.
| Metrics | Description |
|---|---|
| Total opens | The total number of times the email was opened. Multiple opens by the same recipient are also counted. |
| Open rate | The percentage of delivered emails that were opened. |
| Unique opens | The number of emails that were opened by unique recipients. Each recipient is counted only once, even if they open the message multiple times. Seen tracking may be affected by privacy settings, such as disabled read receipts. |
| Unique open rate | The percentage of delivered emails that were opened by unique recipients. Seen tracking may be affected by privacy settings, such as disabled read receipts. |
| Total clicks | Total number of times any URL in the email was clicked. Includes repeated clicks on the same link. For example, if an email contains three links and each is clicked twice, the total clicks count is six. |
| Click rate | The percentage of total clicks relative to delivered emails. Calculated by dividing the total clicks with the number of delivered emails. This value can exceed 100% if recipients click multiple links or click the same link more than once. |
| Unique clicks | The number of unique recipients who clicked at least one link in the email. Each recipient is counted only one, regardless of how many links they clicked. |
| Unique click-through rate | The percentage of unique recipients who clicked on a link compared to the total number of emails delivered. Each recipient is counted only once, regardless of how many times or on how many links they clicked. |
| Unique clicked URLs | The number of distinct URLs that were clicked at least once within an email. Multiple clicks on the same URL do not increase this count. |
Additional charts
The following charts are also available:
| Chart | Description | Requirements |
|---|---|---|
| Unique opens vs opens | Compares the number of recipients who opened the message with the total number of opens, including repeated views. | Open tracking |
| Click-to-Open rate | Shows how many of the recipients who opened the message also clicked a link. | Open tracking + URL click tracking |
| Unique opens vs unique clicks | Compares the number of recipients who opened the message to the number who clicked a link. | Open tracking + URL click tracking |
| Unique clicks vs total clicks | Shows how many recipients clicked at least once compared to the total number of all clicks. | URL click tracking |
| Unique open rate vs open rate vs delivery rate | Compares different open-related rates alongside the delivery rate. | Open tracking |
| Unique open rate vs open rate vs unique CTR vs click rate vs delivery rate | Provides a full view of how many recipients engaged with the message, from delivery through to link interaction. | Open tracking + URL click tracking |
| Unique CTR vs click rate vs delivery rates | Compares how many messages were delivered, how many received any clicks, and how many were clicked by unique recipients (unique click-through rate). Helps evaluate both total and individual engagement against delivery volume. | URL click tracking |
Complaints and unsubscribes
This section provides insight into how recipients responded negatively to your message, such as marking it as spam or unsubscribing from future communication.
| Metrics | Description |
|---|---|
| Unsubscribes | The number of message recipients who unsubscribed or opted out of receiving future messages from the sender. |
| Unsubscribe rate | The percentage of recipients who unsubscribed (opted out) from future messages from the sender. |
| Spam complaints | The number of emails that were marked as spam by recipients. |
| Spam complaints rate | The percentage of delivered emails that were reported as spam. |
Additional charts
The following charts are also available:
| Chart | Description |
|---|---|
| Unsubscribes vs spam complaints | Compares the number of recipients who unsubscribed with those who marked the message as spam. |
| Unsubscribe rate vs bounce rate vs spam rate vs delivery rate vs unique open rate | Visualizes key delivery and engagement metrics alongside negative responses to help assess campaign performance. |
Voice
Delivery analytics
On the Delivery tab, you can view the following metrics:
| Metrics | Description |
|---|---|
| Answer seizure ratio | The percentage of seized calls (calls that rang) that were successfully answered. |
| Answered calls | Total number of calls that were successfully answered. |
| Average call duration (sec) | The average length of answered calls, measured in seconds. |
| Deliverable destinations | Number of valid destinations after processing. Invalid, duplicate, or placeholder errors (for WhatsApp) are excluded. If the same destination is used with different call content, each instance is counted separately. |
| Seized calls | The number of outbound calls that reached the recipient’s device and started ringing. |
Additional charts
The following charts are also available:
| Chart | Description |
|---|---|
| Total attempted calls | Number of outbound call attempts initiated. |
| Total attempted calls by country | Breakdown of call attempts by destination country. Top 5 items displayed. |
| Total attempted calls by network | Breakdown of call attempts by mobile operator. Top 5 items displayed. |
| Total answered calls | Total number of calls that were successfully answered, including both human and machine pickups. |
Performance analytics
On the Performance tab, the following Voice-specific engagement metrics are available:
| Metrics | Description |
|---|---|
| Average call duration (sec) | The total duration of all answered calls, measured in seconds. |
| Answer rate | The percentage of attempted calls that were successfully answered. |
| Busy rate | The percentage of attempted calls that failed due to the recipient's line being busy. |
| Call hang-ups | The total number of call terminations, including those ended by users or due to system issues. |
Additional charts
The following charts are also available:
| Chart | Description |
|---|---|
| Average time to answer | Shows the average time it takes for recipients to answer calls. |
| Answer rate | Displays the percentage of attempted calls that were successfully answered. |
| Busy rate | Visualizes the percentage of calls that received a busy signal. |
| Answer seizure ratio | Displays seizure-to-answer success for routing optimization. |
| Call hang ups | Shows how and when calls were terminated across the campaign. |