Mobile apps dashboard
The Mobile Apps Dashboard will help you easily track how app users respond to your messages.
Dashboard contains a set of key metrics that will give you analytical insights which you can use to improve your communication strategy and achieve your business goals.
How to view the dashboard?
- Log in with your credentials on the Infobip web interface.
- Navigate to the Analyze module on your homepage.
- Select Mobile Apps from available channels and define a time range.
Define the time range you want to analyze by using the predefined menu, or select a custom range if you want to track the specific time related to (e.g. one of your campaigns).
Traffic and Activity
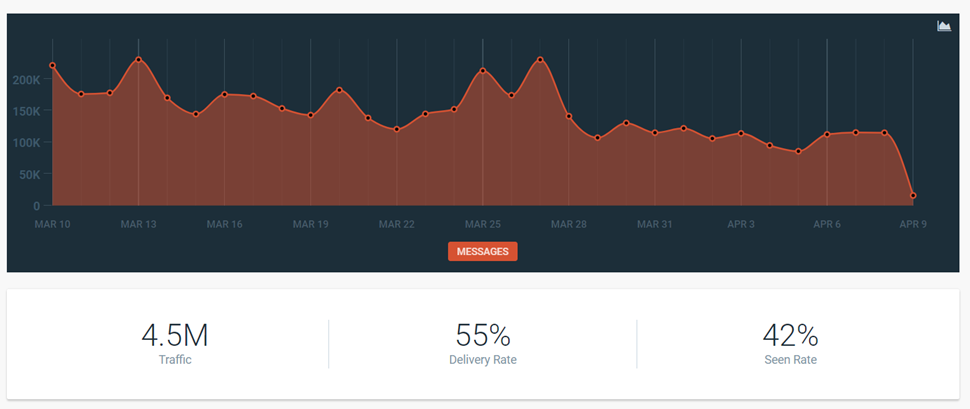
- Traffic graph – The number of push notifications and in-app messages sent in a specific time range. This includes all sent messages, both delivered and undelivered.
-
Seen rate for mobile push – Ratio of mobile app users who clicked the push notification to the total number of devices that received the push notification.
-
Click rate for in-app messages - Ratio of mobile app users who tapped the Primary button in the in-app message or on the banner to the total number of messages that was sent to all end users.
One of the key metrics that determines the success of any mobile application is user activity.
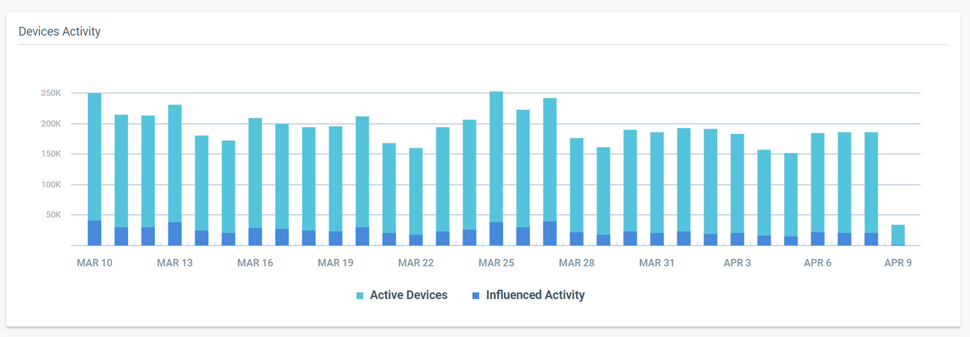
- Active devices – Unique number of devices on which the mobile application was opened at least once during a selected time frame.
- Influenced activity – activity of your mobile application audience which was triggered by direct application open from delivered push notification or if application was opened within next 6h after push notification was received.
When it comes to the strategy for engaging active users, it's important to understand how many users were engaged in the campaign or were influenced by the campaign.
There are two possible situations:
The user opens the received push notification – As a result, the user will open the application and become active. That's called direct influence.
The user saw the push notification on their lock screen – The notification was delivered, but the user didn't open it, meaning the notification wasn’t seen. However, this message still got their attention, so the user comes to the application later (within 6h) to check what's new in the application. Such behavior is called indirect influence.
These two metrics, Direct influence and Indirect influence, combined together are called Influenced activity.
Summary
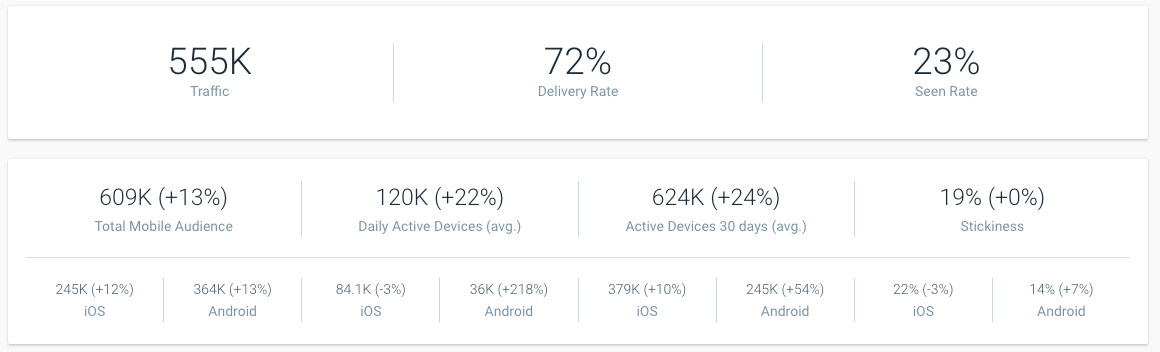
- Total application audience – Total number of unique devices with your mobile application installed on them. It includes both active and dormant users. This number may vary as it takes into account new installs and uninstalls. In other words, this number shows the current number of valid mobile application installations.
- Daily active devices – Average number of all unique devices that were active within the application in the defined time range. It indicates the growth or decrease in daily user activity compared to the previous period. Daily active devices is based on the calendar month and the UTC time zone.
- Active devices 30d period – All unique devices that were active for the past 30 days. Each day is compared to the period of previous 30 calendar days. The trend will show whether your audience increased or decreased compared to the previous month.
- Stickiness – The most concrete overview of your mobile app audience. Showcases the correlation between monthly active and daily active devices.
Here’s how this is calculated:
Stickiness = (Daily active devices/Active Devices 30 days) * 100
If the mobile app audience adoption value is high, then stickiness will be high (100% is the highest value). The higher the number, the better.
Net Rate
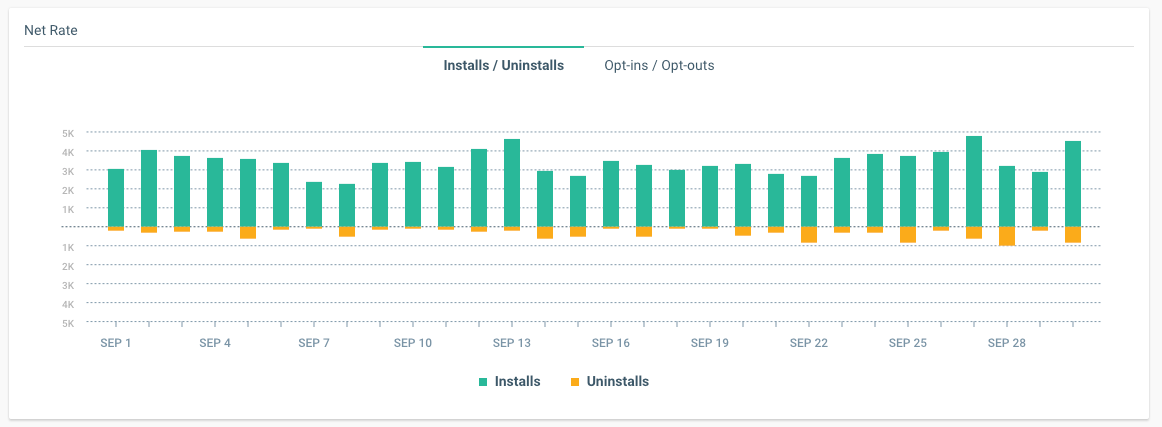
- Net Rate – correlation between churn rate and new acquired users.
For applications in production there is always some fluctuation between new users and those who uninstall it. These metrics here represent the value of your application. For example, if you have more new users than the ones who uninstalled the app, it’s a positive trend. Additional controlling metric will be Total application audience.
If you started sending too much traffic which is not relevant to your customers, you’ll see push notifications opt-out trend increasing as the result of customers feedback on intrusive messaging.
Install/Uninstall
Install event is tracked when the end user installs mobile application and launches it for the first time.
Uninstall event is tracked based on each 24h mobile audience service check on availability. Infobip platform performs a dry run validation on synced device tokens with Clouds (APNS, FCM). Uninstall event can also occur at the moment of sending a push notification. In this case the message will be associated with undeliverable status (opens in a new tab) and the uninstall reason.
Opt-in/Opt-out
Opt-in – Event is tracked on install and permission request to send push notifications. If the customer grants permission after it was declined, opt-in event will be counted.
Opt-out – Event is tracked if mobile app customer declines permission of mobile application to send push notification. It can be in the moment of permission request, as well as later on when the end user opts out of the system preference.
If you use the option to disable mobile application install from targeting and expose it to your customer in your SDK configuration, changes of the trigger will be counted as opt-in/opt-out accordingly.