Analytics
Use analytics to visualize your People data and gain insights into profile behavior and visitors to your site.
Learn more about how to perform audience segmentation based on people's behavior, and which metrics are currently available for this. Or, you might decide to analyze funnels based on user activities and their profile information.
Leverage website visitor insights to see how your website visitors convert to leads and customers.
To obtain analytics, you must have the following:
-
Customer profiles integrated with People, to store and manage end user data.
-
Events set up to track customer actions.
To track customer actions that happen within Infobip products, enable standard events.
To track events coming from other systems, define custom events in People and integrate them with the external system.
Events Segmentation Analytics
This basic type of event analytics serves to allow users a better insight into their audience. Events Segmentation has three core blocks:
- Selecting segments
- Selecting events to show
- Events data visualization
Select Segments [#select-segments-events-segmentation-analytics]
Behavior data helps you better understand how your audience interacts with an app or a website. The audience segmentation lets you dig a little deeper and see the difference in that behavior. The segments are based on the person attributes - static data related to each end user whose information is stored in the Peoplemodule. This is usually some very current information that is likely to change in the future.
The segments that have been created earlier can be used again. Click Add Segmentand the right-side panel will appear.
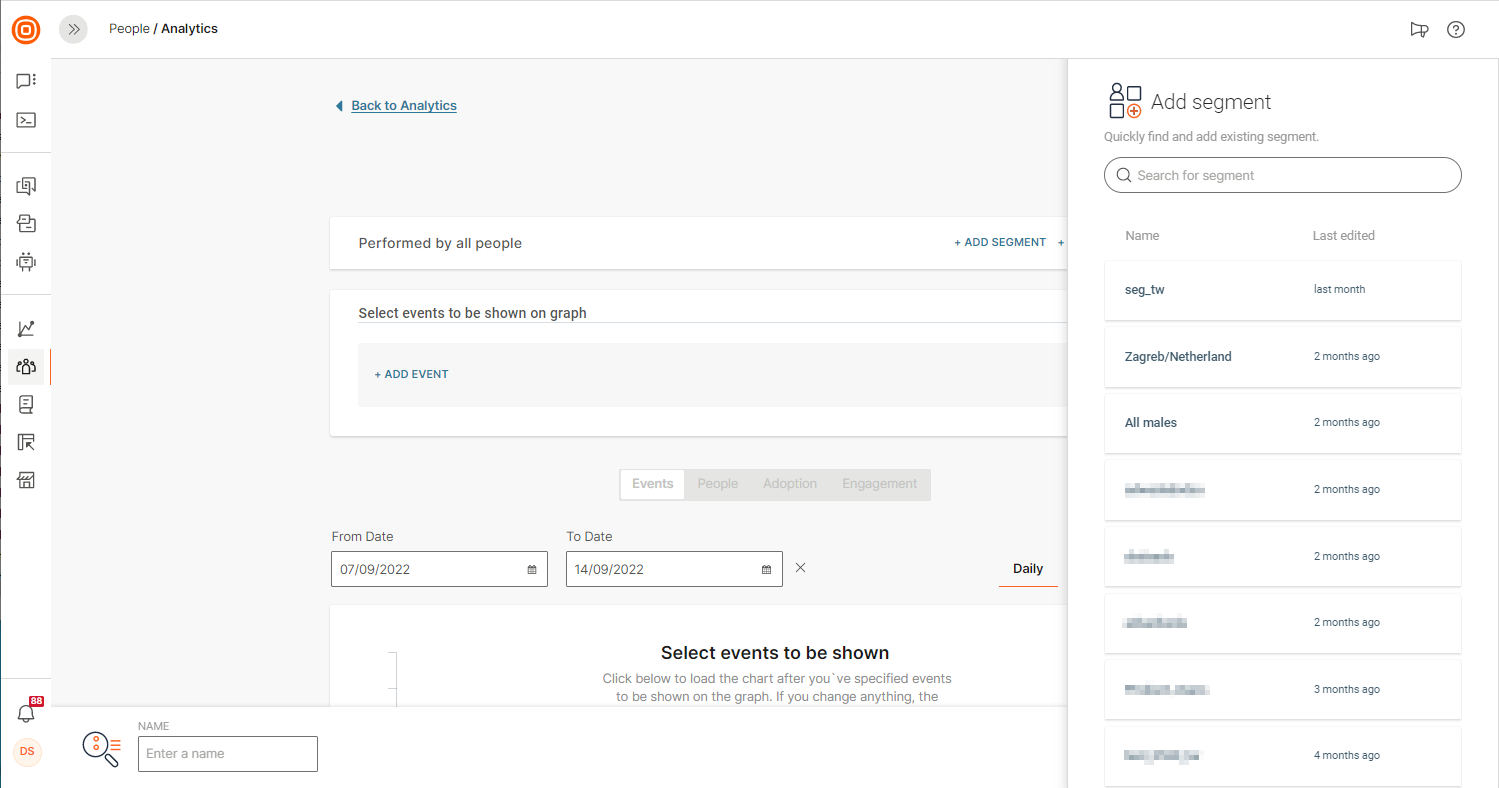
If you don’t find what you need in the existing segments list, the other option is to create a new segment for your report.
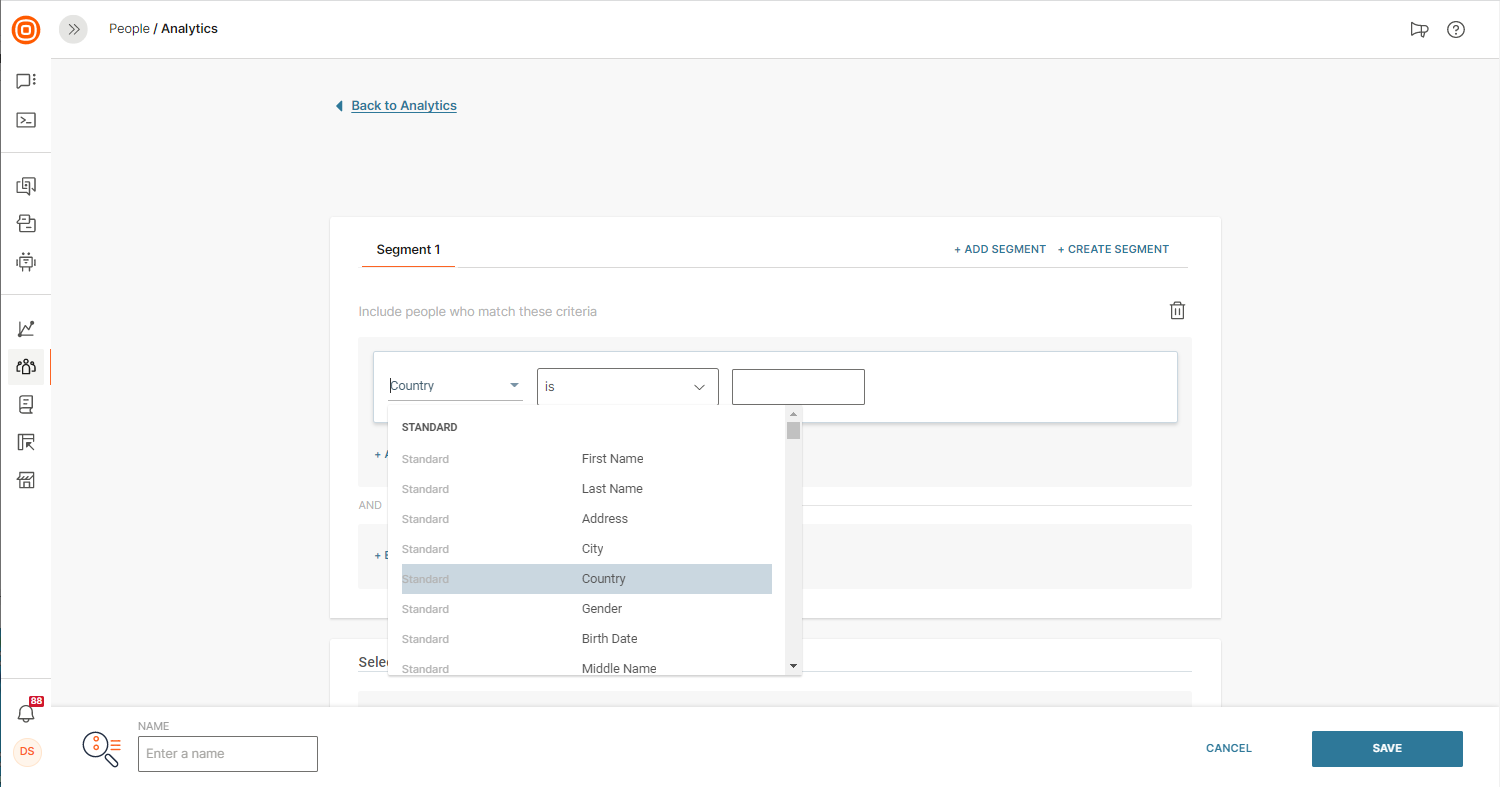
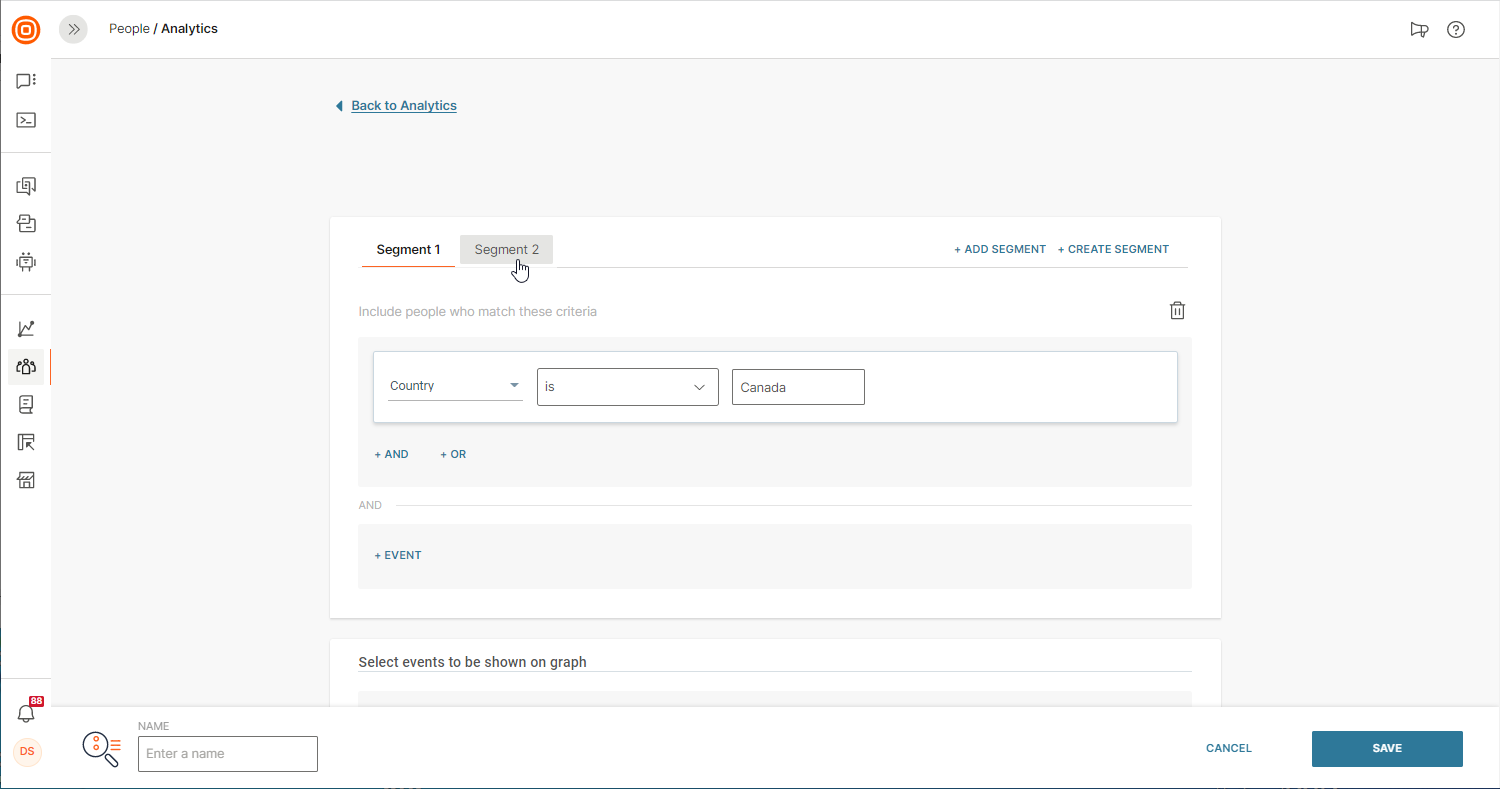
Up to 4 segments can be created in the Event Segmentation analytics. The image below displays a basic 2-segment scenario.
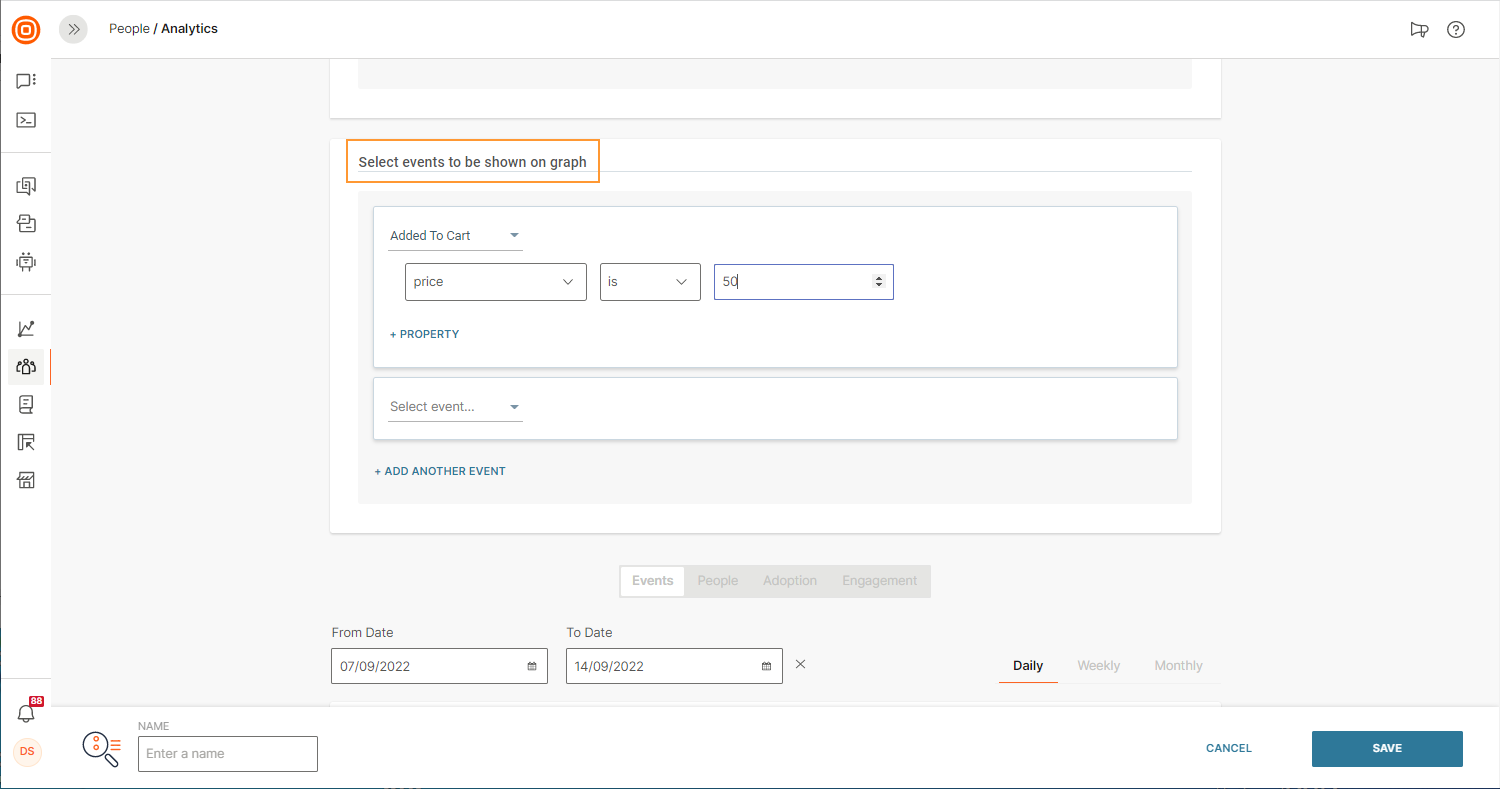
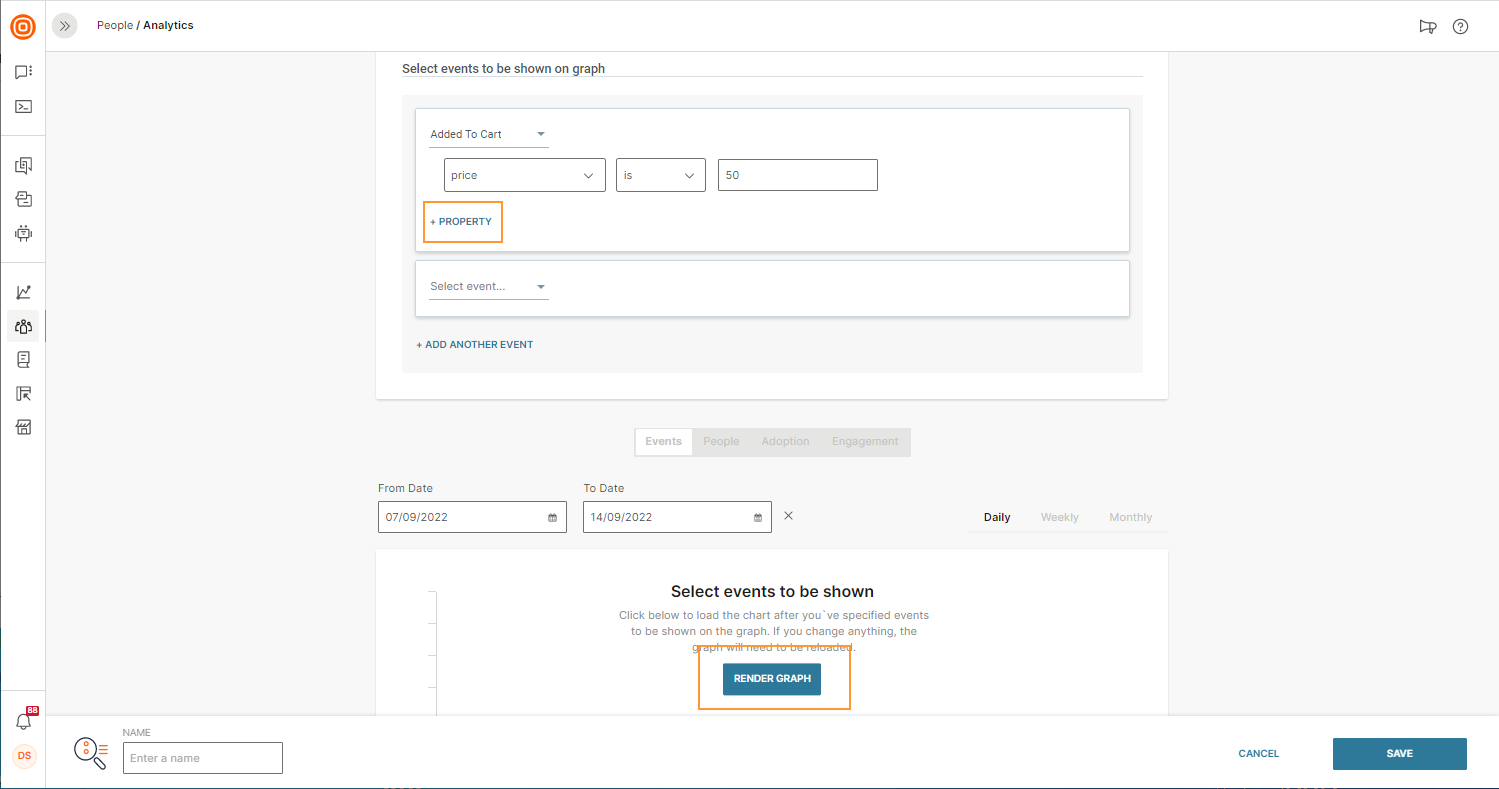
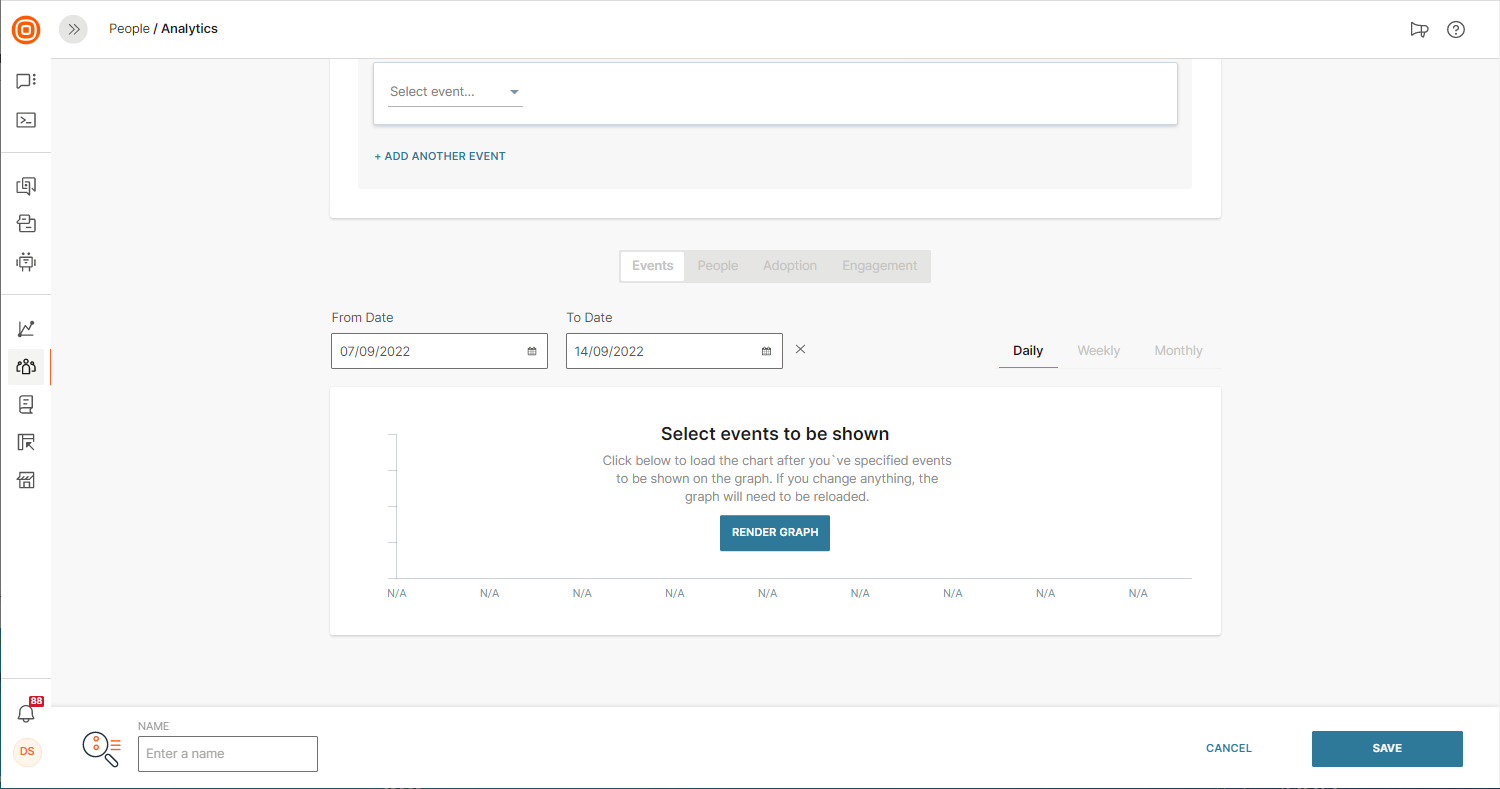
Select Events to Show [#select-events-to-show-events-segmentation-analytics]
Events reflect user actions inside an app or on a website. Events Segmentation analytics can display up to 4 different events on the user activity graph.
On the Events Segmentation page, scroll down to Select events to be shown on graph and decide which events you want to include.
Events Data Visualization [#events-data-visualization-events-segmentation-analytics]
Click the +PROPERTY link to set the event properties. When you include properties, the graph will also contain certain conditions that have been met and are related to that event. Take a music streaming app as an example: if you select the Song Played event only, the graph will show how many people listened to the songs., and if you include a song genre or name, the graph will show how many times people listened to the specific genre or song.
The data related to the event will be shown as a line graph chart. When you’re done specifying segments and events that should appear on the graph, click RENDER GRAPH.
Remember to select a time period that you would like visualized (modify this later if you need to). Choose the last 7 days, last 30 days, this week, previous week, or a custom range that you define yourself. You can also get information for different periods within your set timeframe. For example, if you need a weekly graph, but also want to see daily data, select Dailytoo.
Metrics [#metrics-events-segmentation-analytics]
Four metric types are currently available on the Events Segmentation page:
- Events
- People
- Adoption
- Engagement
Events metrics show the number of selected events that happened on a specific date. You will get a better idea of whether the users' amount of activity aligns with the goals you have set for your product.
To understand how many people performed specific actions within different time frames, turn to the People metric.
The Adoption metric reveals whether certain parts of the app’s functionality are being used by your audience or a specific audience segment. Keep in mind that the best practice would be to set up a segment of people based on the registration date. You can select a segment of people who registered in May and then check out the report for Adoption related to the months following the registration and to the most important features that you have. If you are going to use the Adoption metric without a registration-based segment, you may get incorrect information because the audience will include new users who were not able to perform any actions before they registered!
The Engagement metric helps you understand how many actions are generated by one person on average. If you are trying to inspire your audience to perform many actions during the day, this report will uncover whether there is a growth or decline in engagement. As with the Adoption metric, you will need to select a segment of people based on the registration date. Otherwise, calculations will include 'new' users who simply could not have performed any actions before the registration!
Funnel Analytics
A sequence of user actions on your website or mobile app tracked with Funnel Analytics shows how different audience segments behave so you can better adapt your engagement strategy.
Let's take user activation as an example. Activation often means that a customer goes through a number of steps before realizing that a specific product is something they need. The ultimate goal of marketing teams is to encourage more customers to reach that realization and complete the funnel. Before you are ready to analyze the funnel data and adapt campaigns accordingly, you need to have the customer information stored inside the Infobip People module and be able to track events.
Next, in the People module on the Infobip web interface, select Funnel Analytics and do the following:
- set up an audience segment or use the whole audience
- select the sequence of events that represent your funnel
- specify conversion window (the adequate timeframe for the funnel)
- specify the timeframe for funnel calculation
We will quickly go through each step, and then you can go ahead and start analyzing and adapting your strategy!
Segments [#segments-funnel-analytics]
Calculate a funnel either for all the people you have or for certain audience segments. Up to 2 segments can be used in funnel analytics. To specify the segment, select the existing standard attribute (such as country, city, etc.) or create a custom one.
Segments are helpful if you believe that certain groups of your audience might be completing the funnels differently. If that's the case, you will need to figure out the reasons and how to make your ‘lower performing’ users convert at the same rate.
You can use the existing segments or create new ones for this report.
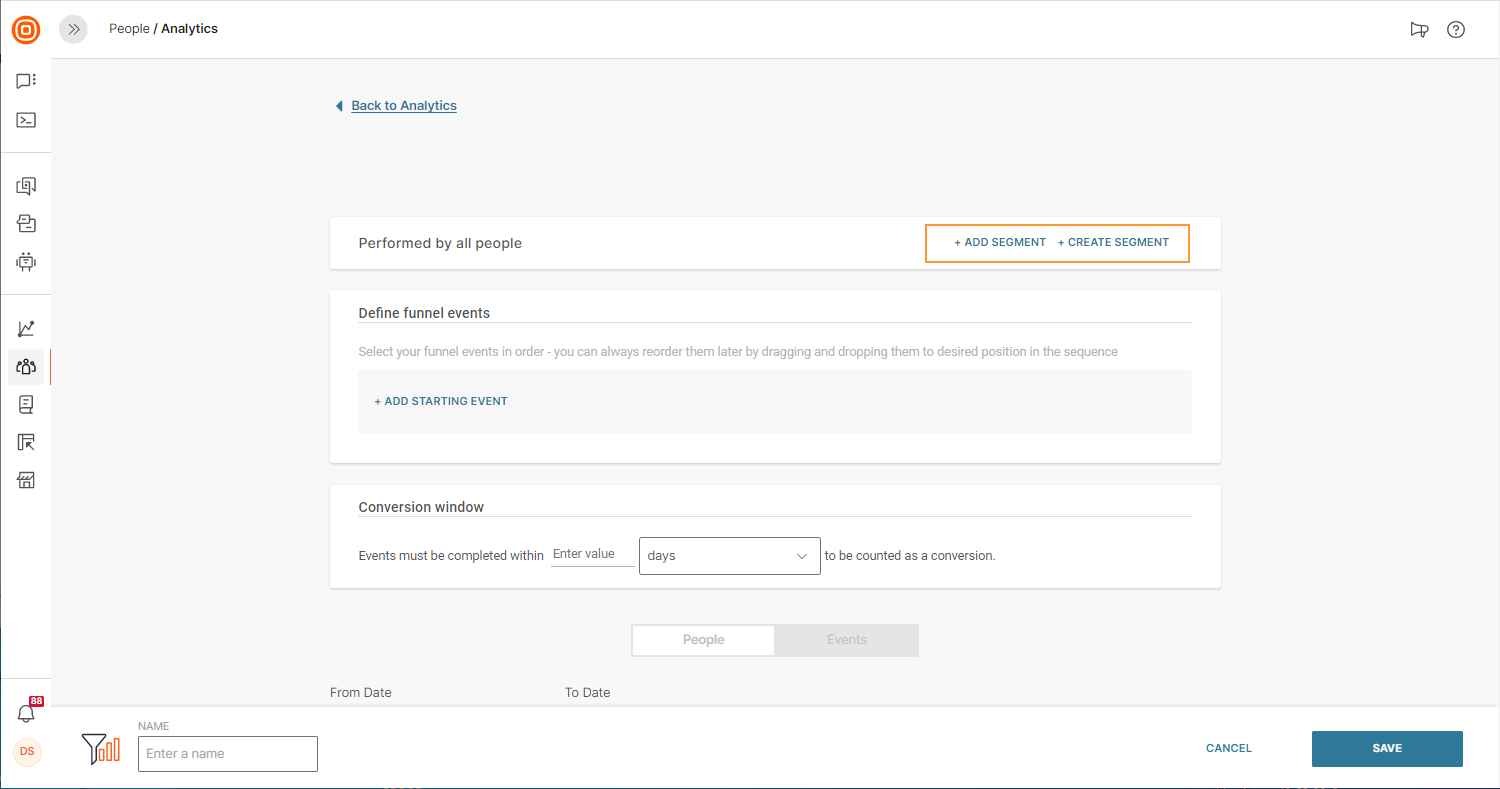
Events in Funnel [#events-in-funnel-funnel-analytics]
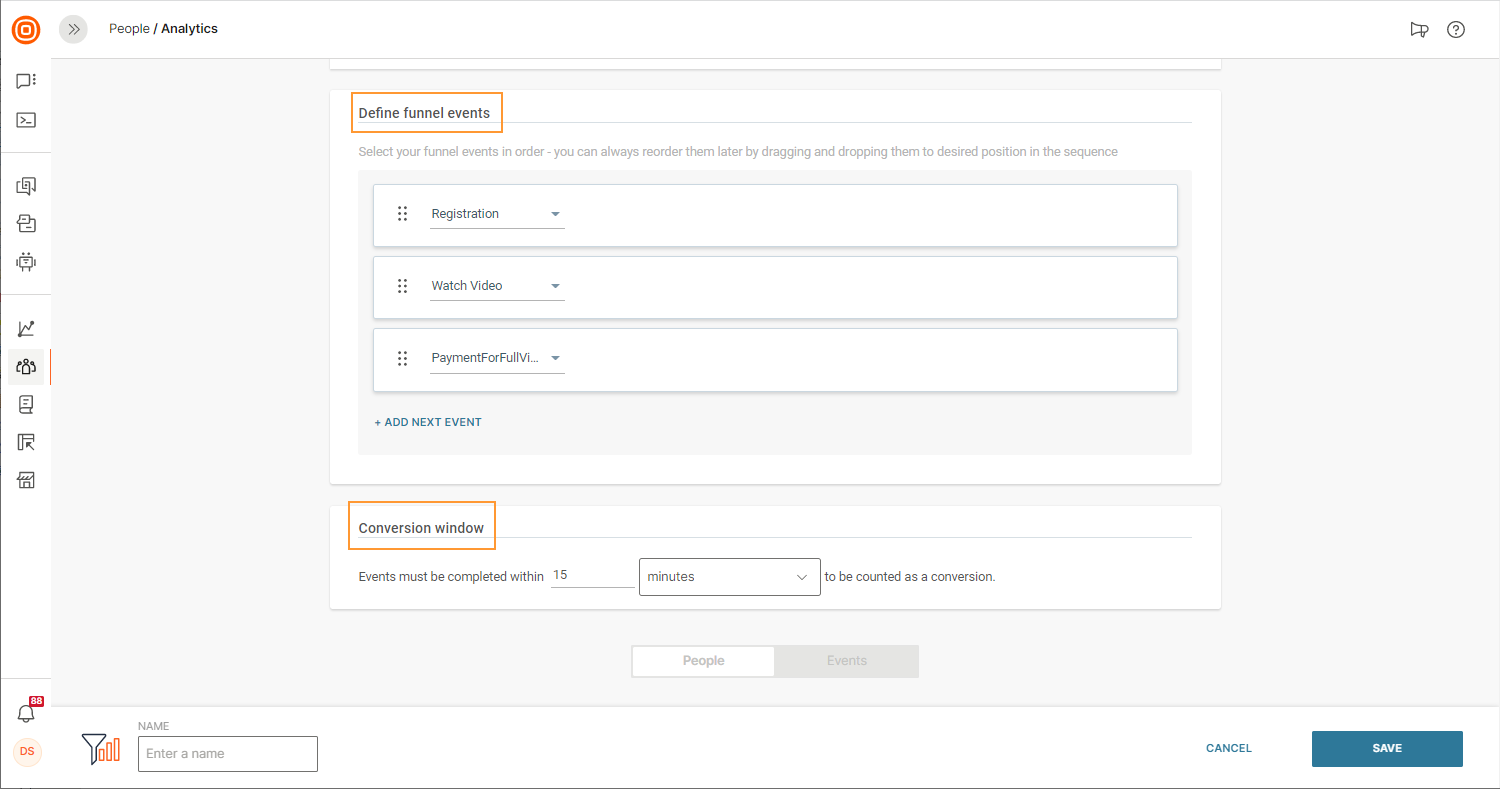
The next step is to define the funnel. Think about what sequence of user events has to happen for the funnel to be completed. This order of events is important, and it can't involve any ‘optional’ in-between steps. Keep in mind that you can include up to 7 events in one sequence.
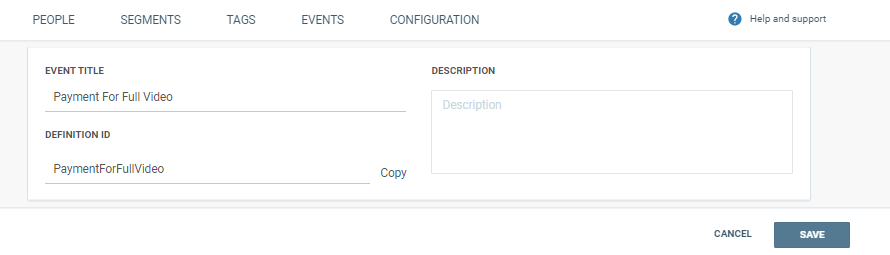
Imagine an example case with the user registration as the starting event and consider a possible timeframe for the entire sequence: Registration - 12:05pm; Watch video - 12:10pm; Payment for full video - 12:30pm.
The screenshot below shows how to set up events that you will include in the funnel.
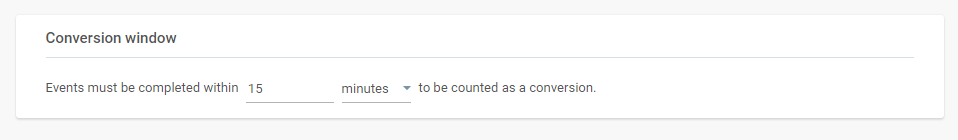
Conversion Window [#conversion-window-funnel-analytics]
Define an approximate amount of time that will pass between the first and last step in the funnel. For example, you can set the conversion window to 15 minutes, as we just did for the Registration- Watch Video - Payment for Full Video sequence.
If all the steps are not completed within 15 minutes, the funnel will show a drop-off.
Calculate the Funnel [#calculate-the-funnel-funnel-analytics]
To record one unique person within a given timeframe and a given conversion window, the whole funnel should happen. If it happens successfully at least once without drop-offs, then for that person the funnel is marked as complete. If that person enters the funnel multiple times but has at least 1 complete funnel, this still counts as a success and all other entries will be disregarded.
Funnel Graph [#funnel-graph-funnel-analytics]
Pick a specific timeframe for the funnel calculation. But consider the fact that your app/website evolves constantly and the same is true for your acquisition efforts and communications strategy. That also means that the behavioral pattern of your users from six months ago may not match the present one.
When you are ready, click Render Graph. You will see the data breakdown for both People and Events.
Breakdown by the number of people
The resulting graph will reflect the funnel that you have specified. The number on top of the bar represents the percentage of people that have arrived at each specific step in the sequence.
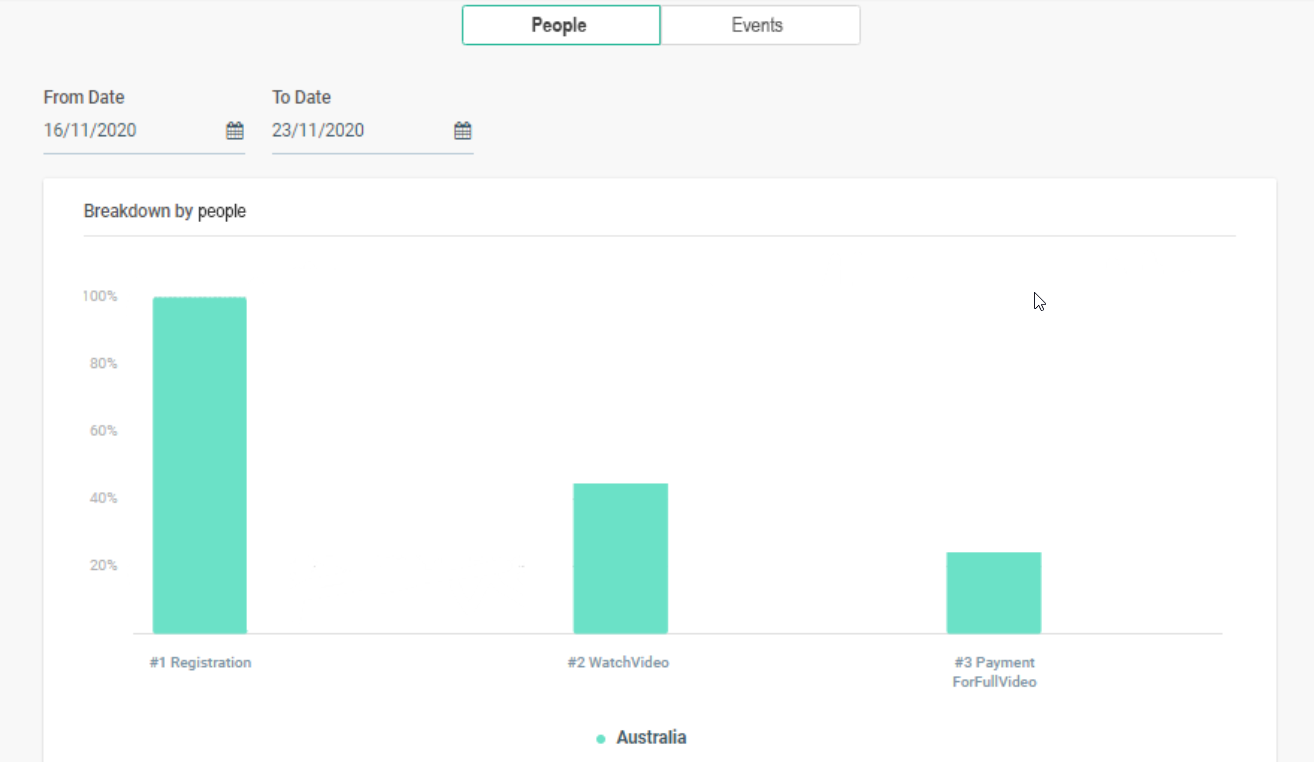
Hover over the bars to see both the percentage of people who reached the specific step and of those who dropped off from the previous step, as well as the exact numbers for both.
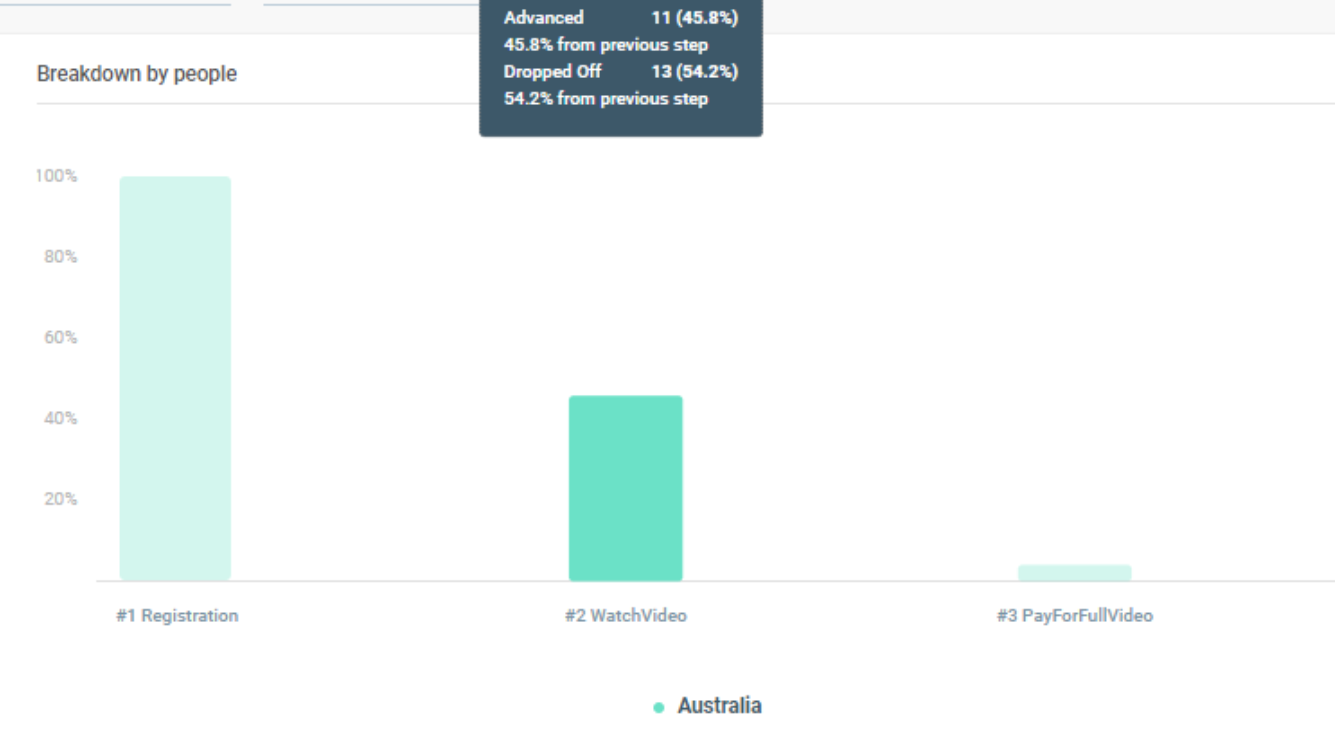
Breakdown by events
Once the first step happens, that’s when each new funnel starts. The data displayed on the top of each step in the sequence takes into consideration the events that have reached that specific step. But, same as with the Breakdown by the number of people, when you hover over the bars, a pop-up will appear showing the percentage of people who reached the specific step and who dropped off from the previous step, as well as the exact numbers for both.
This graph is helpful when you want to understand, for example, how many sequences were started but not finished, which events in the funnel might need improvement, etc.
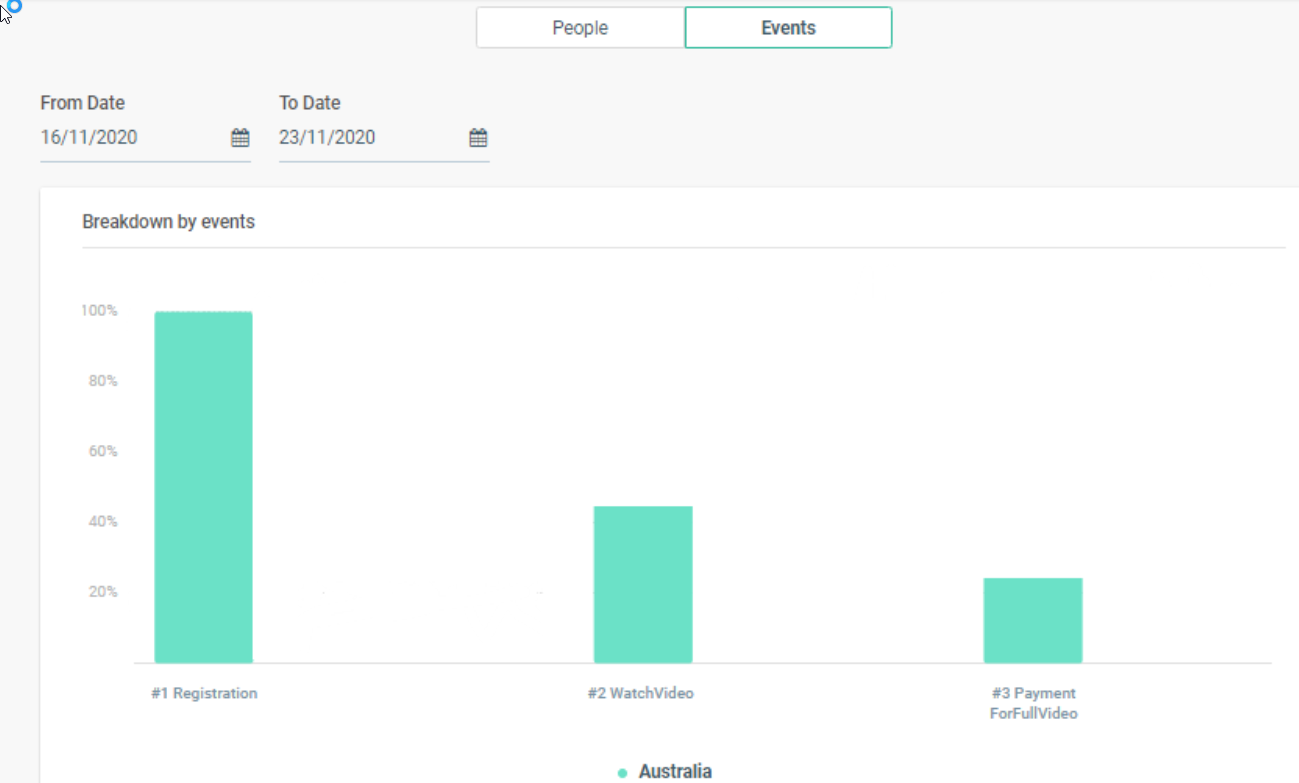
Table View and Tags [#table-view-and-tags-funnel-analytics]
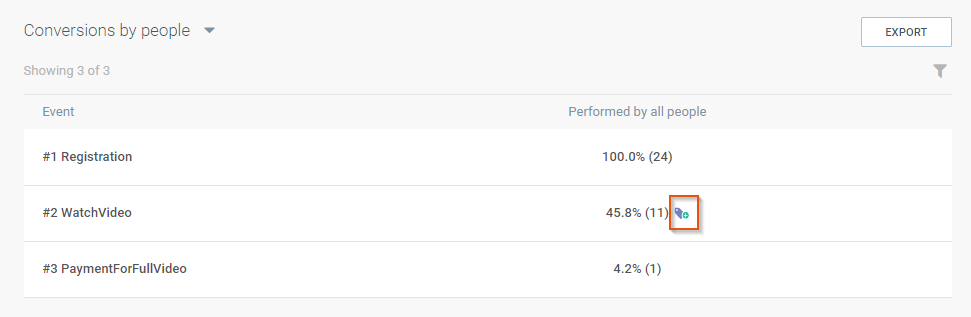
The information from the graph can be shown in the table view as well. There, you will find both exact numbers and percentages. On the image below, the values in the segment columns show the number of people that arrived at the specific step from the previous one.
There is one additional feature in the "Performed by the number of people" table view: you can add a tag to some group of people from the funnel so that later you can use it for communications or further analytics. Hover over the exact number and click the tag icon that will appear next to the exact number. On the pop-up menu, select the existing tag or create a new one.
Tagging will help with future communication or analytics in situations when you want to select this specific group of people.
Save Presets [#save-presets-funnel-analytics]
The Events Segmentation or Funnel Analytics reports can be saved and available to you at any time so you can see the data about the events and customer conversion. This information should help you plan and prepare for future campaigns.
View all the presets together, or select only the Event Segmentation or the Funnel Analytics ones. Duplicate and reuse the preset instead of building a new one every time. If you are sure you won't need the same preset again, delete it.
Website Visitor Insights
Visitor insights give you a better understanding of how visitors get converted to leads and customers for your website.
Website browsing events are automatically saved to person profiles so you can filter and segment your audience to personalize the customer journey and create bespoke engagement strategies. Use website visitor analytics to visualize and analyze these trends.
Filter website visitor insights by date and then export the data or segment your audience into more appropriate groupings for your requirements.
Profile Type Conversion [#profile-type-conversion-website-visitor-insights]
View the conversion statistics for changes to a person profile type as they are converted from anonymous visitors to leads and then customers. We track events that naturally lead to profile type conversion, such as creating an account on the website or purchasing an item from the webshop.
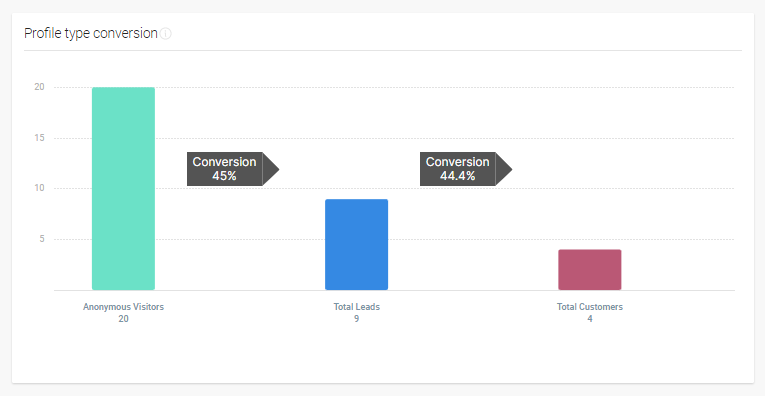
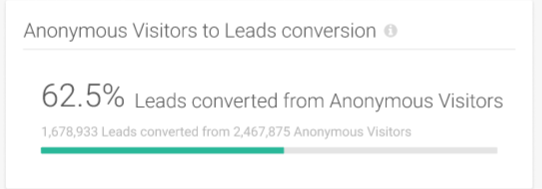
Anonymous Visitors to Leads Conversion [#anonymous-visitors-to-leads-conversion-website-visitor-insights]
Number and percentage of anonymous visitors who have been converted to leads during the selected time frame.
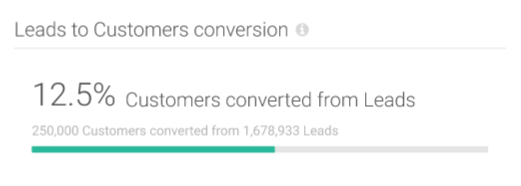
Leads to Customers Conversion [#leads-to-customers-conversion-website-visitor-insights]
The total number of customers converted from leads during the selected time frame.
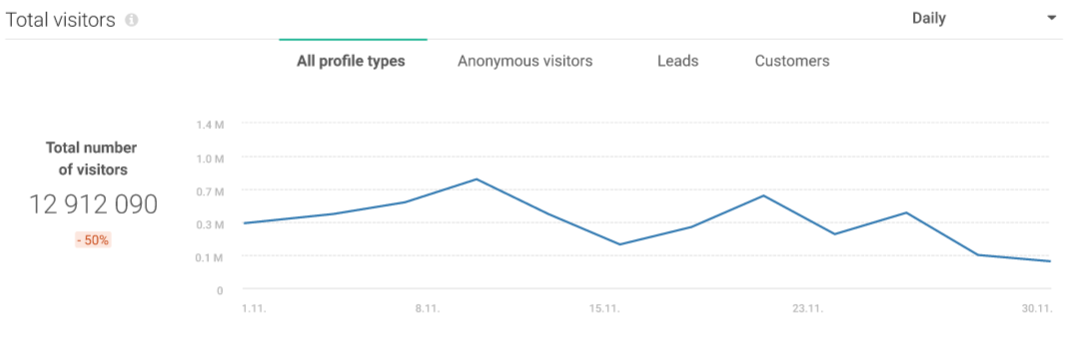
Total Visitors [#total-visitors-website-visitor-insights]
Total visitors shows the total visitor audience by date and split by all person profile types, anonymous visitors, leads, and customers. Data can be grouped by day, week, and month.
The percentage indicator below the total number of visitors shows the % change (increase or decrease) in visitors versus the previous period.
The calculation for % growth is ((this month visitors - last month visitors)/last month visitors) * 100.
So, if there are 1200 visitors for the last 7 days and there were 1000 visitors during the previous 7 days, then the growth will be 20% using the calculation ((1200 - 1000)/1000) *100.
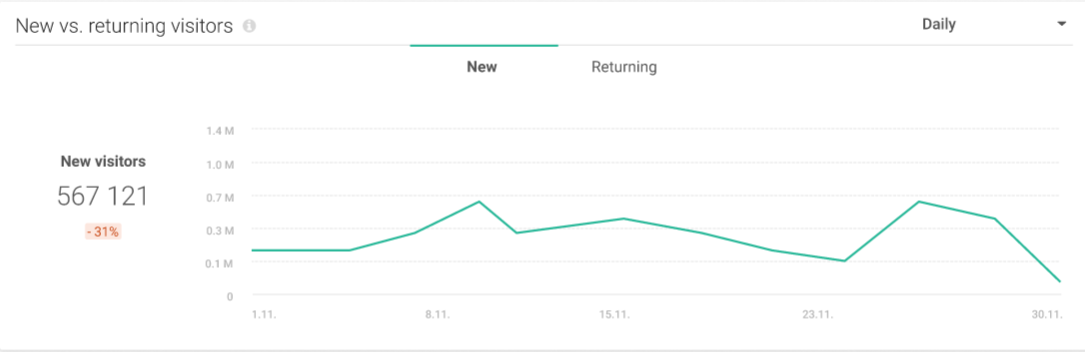
New vs. Returning Visitors [#new-vs-returning-visitors-website-visitor-insights]
This graph shows how many new visitors and returning visitors visit your site in a given time period (daily, weekly, or monthly).
New visitors are classed as site visitors who have not been identified as a known person (i.e. someone who has visited the site before the selected time period) and they do not have a person profile in People. You will generally find anonymous visitors are classed as new visitors since leads and customers will have visited your site in the past and interacted with it in some way such as completing a form or creating an account.
Returning visitorsare site visitors who have already had a page view event before the selected time period. They could be anonymous visitors, leads or customers depending on what stage they are in the customer journey,
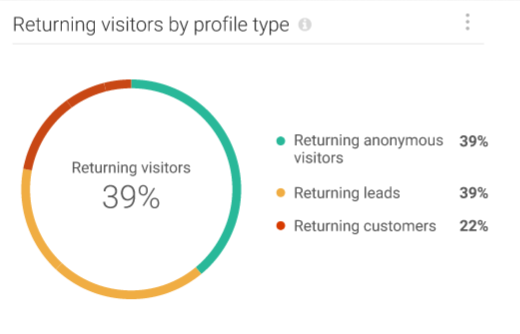
Returning Visitors by Profile Type [#returning-visitors-by-profile-type-website-visitor-insights]
Use this graph as a returning audience breakdown to see who returns to your website the most.
- Returning anonymous visitors
- Returning leads
- Returning customers
Page Views [#page-views-website-visitor-insights]
- Total count of page view events for the page during the selected time period.
- Visitors (Sum of all profile types)
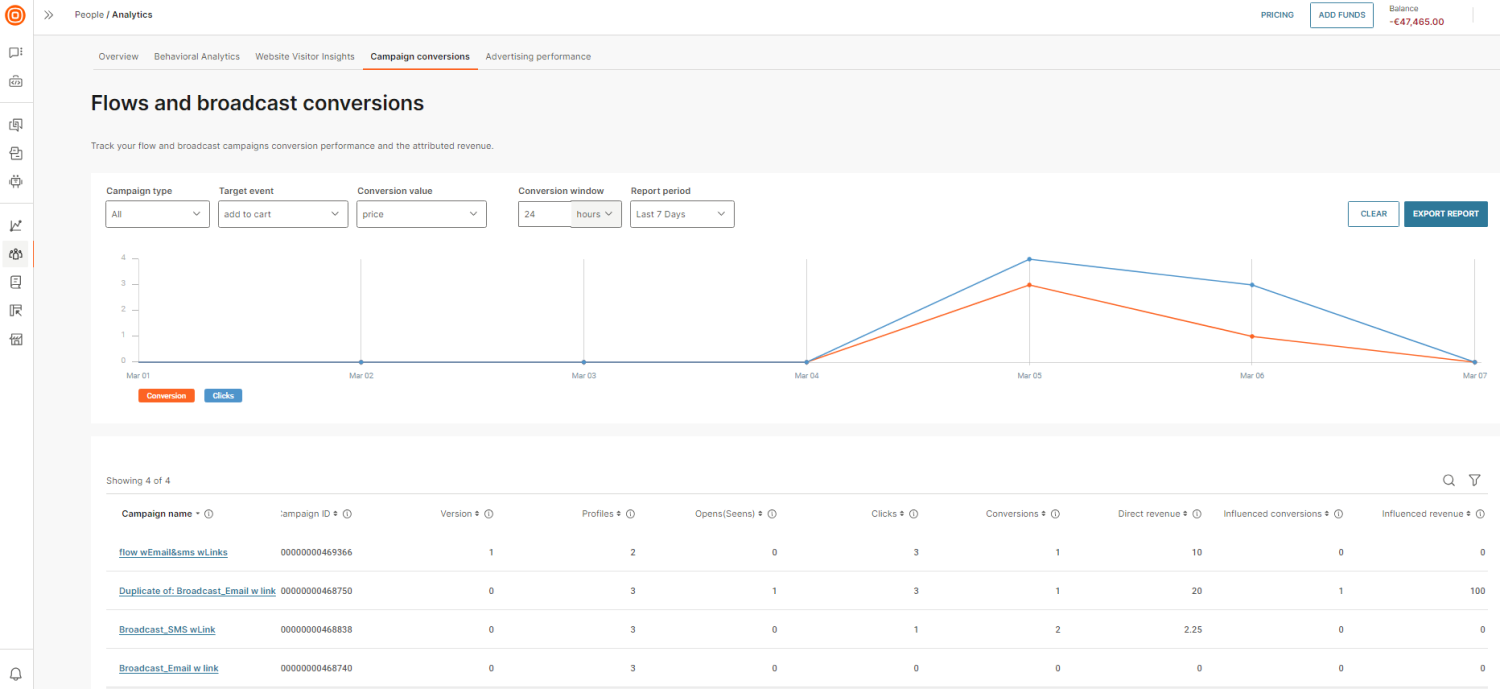
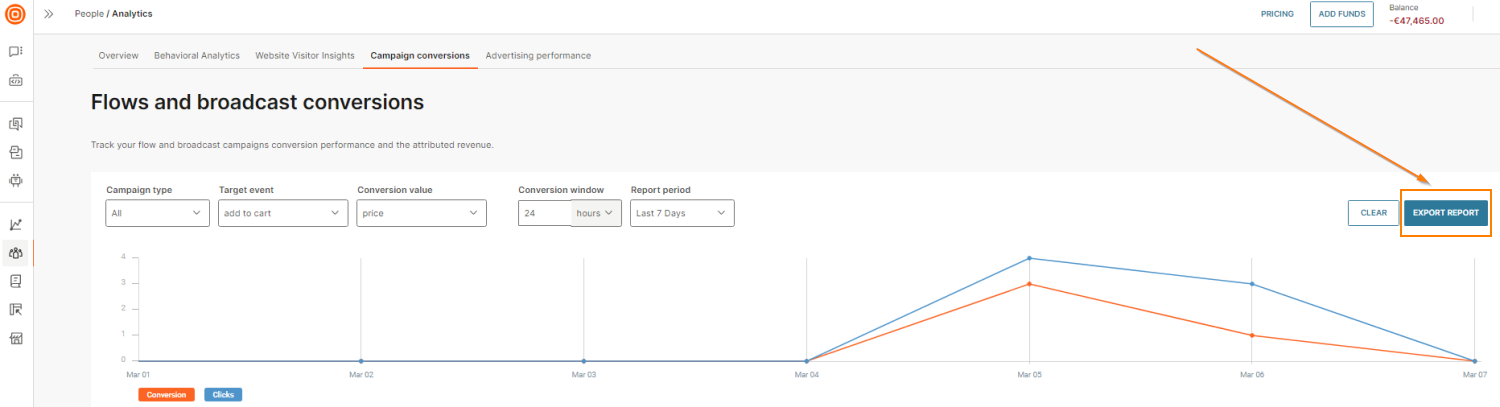
Campaign conversions
This prebuilt dashboard enables you to connect Moments channel metrics with custom events that track end user behavior.
As part of your flow or broadcast campaign, you might send end users links to your website or mobile application. Use custom events to track end user behavior after they click these links. Example: You can track purchase, registration, activating promotion code, or form submission.
You can do the following:
- Track direct and influenced conversions based on the recent click event in the campaign. Example: If the recent click event is a purchase event, it indicates a conversion.
- Track attributed revenue.
The following image shows the attributed revenue for the order field.
Prerequisites [#prerequisites-campaign-conversions]
- Define the custom event that you want to track.
- Integrate the People SDK with your campaign.
- To track URL clicks, you must use URL shortening for the links.
- To track revenue for a campaign, the Purchase event must have a field that contains this information.
View conversion graph [#view-conversion-graph-campaign-conversions]
View the number of clicks and number of conversions.
You can filter the data by the following.
- Campaign type: Select whether you want to view all campaigns, only flows, or only broadcasts. Only campaigns that have at least one channel event are shown.
- Target event: Select the target event that is considered as conversion. Example: Purchase, added to cart, or form submission.
- Conversion value: Select the attribute that contains the order value to calculate direct revenue. Example: order.
- Conversion window: Select a period for which you want to view conversions. Example: You send a Black Friday campaign. You expect the end users to receive the message, select the link to open your website, and purchase your products within 7 days. You can select a minimum value of 1 and a maximum value of 100 minutes, hours, or days.
- Report period: Select the period for which you want to get the report.
View metrics [#view-metrics-campaign-conversions]
You can view the following metrics for your campaigns.
- Campaign name: The display name of the flow or broadcast campaign. Select the campaign name to view the campaign in the associated Infobip solution, for example, in Moments.
- Campaign ID: The unique ID of the campaign.
- Version: The version ID of the flow campaign.
- Profiles: The number of profiles that are part of the campaign.
- Opens (Seens): The total number of all standard channel Open and Seen events that happened during a campaign.
For Email, the standard channel event is Opened. For other channels such as WhatsApp, Mobile push, and Viber, the standard channel event is Seen.
- Clicks: The total number of all standard channel Click events that happened during a campaign.
- Conversions: The total number of events that indicate conversion. These are the events that are performed by profiles in a flow after they click a message within the selected conversion window. In Mobile push, there is no click event. So, the conversion is attributed to a seen event.
- Direct revenue: The sum of values extracted from the attribute that is selected for the conversion event. Example: Purchase event attribute.
- Influenced conversion: The sum of target events that are performed by profiles in a campaign after they open a message, but have not clicked the link. Example: For the Email channel, an end user opens the email but does click the link. Three hours later, they make a purchase. This indicates that the email influenced the purchase.
- Influenced revenue: The sum of values extracted from the influenced conversion events.
Export analytics data [#export-analytics-data-campaign-conversions]
To export the analytics data in .csv format, select Export report.
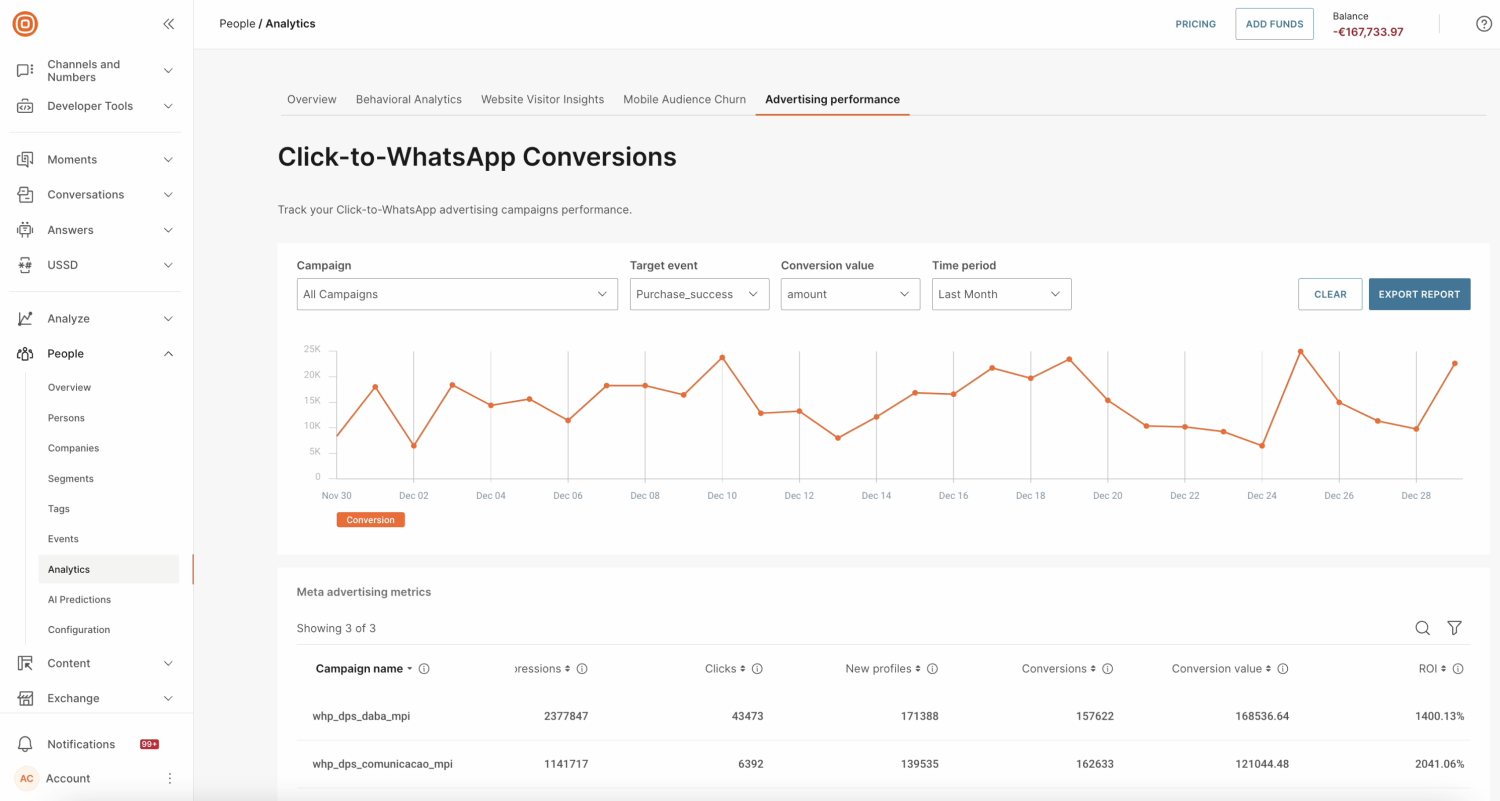
Advertising performance
Track the performance of all your advertising campaigns.
Click-to-WhatsApp conversions [#click-to-whatsapp-conversions-advertising-performance]
Track the performance of your click-to-WhatsApp advertising campaigns. The information about the campaigns is obtained from your Meta ads manager.
Prerequisites [#prerequisites-advertising-performance]
Answers prerequisites [#answers-prerequisites-advertising-performance]
To use click-to-WhatsApp analytics, you must have one of the following Answers plans.
- Grow
- Scale/Enterprise
Meta prerequisites [#meta-prerequisites-advertising-performance]
- Account in the Meta business portal.
- One or more active ad campaigns in Meta ads manager.
Required integrations [#required-integrations-advertising-performance]
Install and configure the Meta Ads Reporting for Infobip Business Messaging app to enable the connection between Meta Conversions API (CAPI) and Insights API. Add this element to your chatbot.
CDP prerequisites [#cdp-prerequisites-advertising-performance]
To track conversion eventsand conversion value, you must have the following:
- Defined custom event that corresponds to the target action such as purchase, registration, or checkout completed.
- Defined event property with a numeric type to track the ROI.
For more information, refer to the Event best practices.
To track custom events in People, you must have one of the following integrations.
Chatbot configuration [#chatbot-configuration-advertising-performance]
In your chatbot, do the following to connect the chatbot with the data in Meta and People.
Add the Meta Ads Reporting for Infobip Business Messaging app [#add-the-meta-ads-reporting-for-infobip-business-messaging-app-advertising-performance]
To send conversion information to Meta, add the Meta Ads Reporting for Infobip Business Messaging app to your chatbot and configure it.
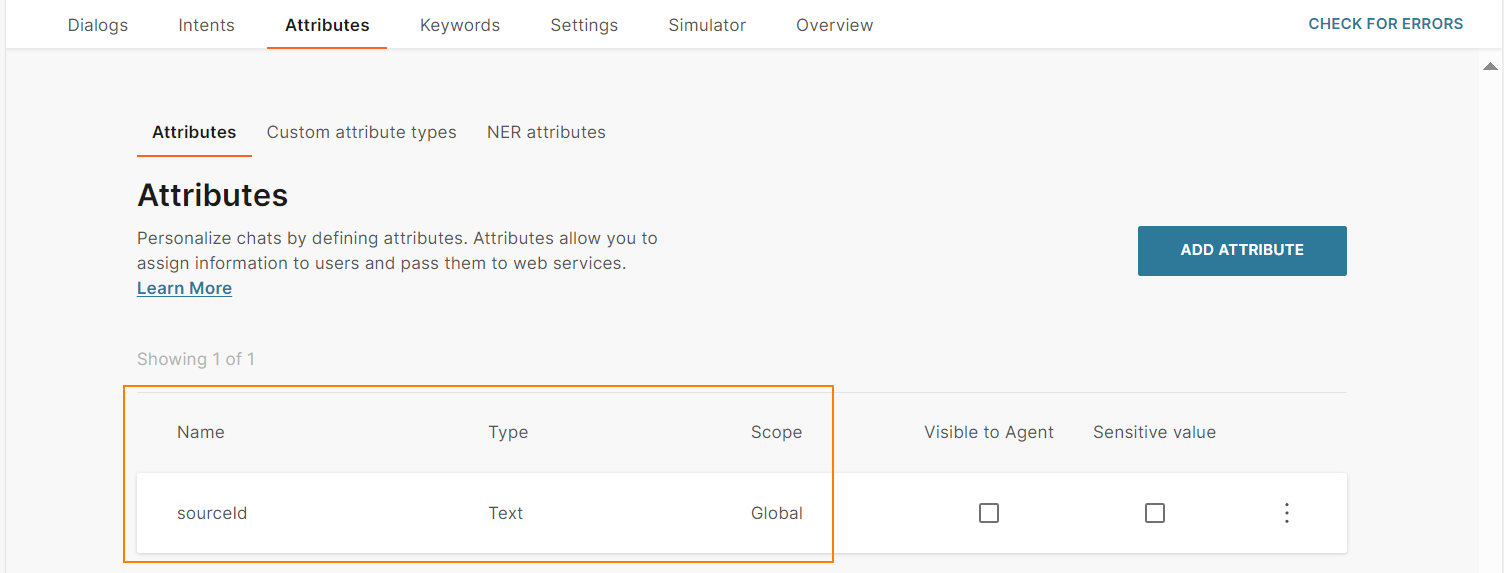
Define Answers attribute [#define-answers-attribute-advertising-performance]
In the Attribute tab, create a new standard attribute of type Text and scope Global. Example: sourceId.
This attribute is used to map Meta ads metrics to Infobip metrics. Use this attribute to pass the value of the whatsAppMoReferralSourceId predefined attribute in Answers to the custom event in People.
For more information about using WhatsApp referral attributes in your chatbot, refer to the Get WhatsApp referral information section in the Answers documentation.
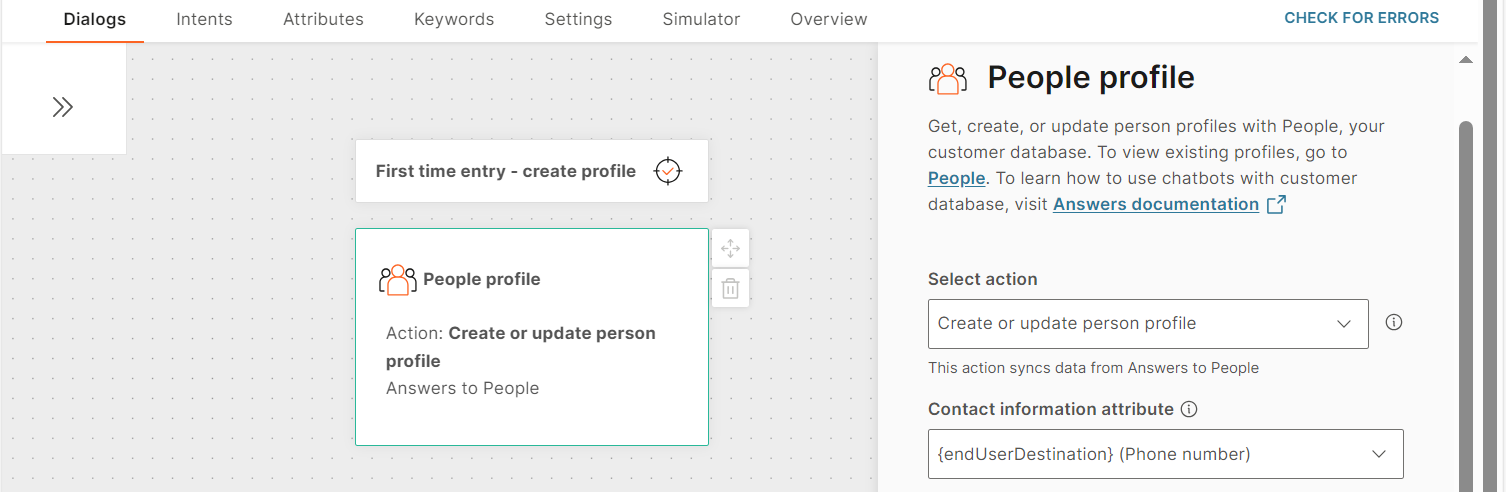
Create or update profiles [#create-or-update-profiles-advertising-performance]
To track the end user journey in the chatbot, use the People profile element that uses the action Create or update person profile.
Pass whatsAppMoReferralSourceId value to the Answers attribute [#pass-whatsappmoreferralsourceid-value-to-the-answers-attribute-advertising-performance]
The whatsAppMoReferralSourceId predefined attribute connects the Meta campaign data to the data in the Infobip web interface.
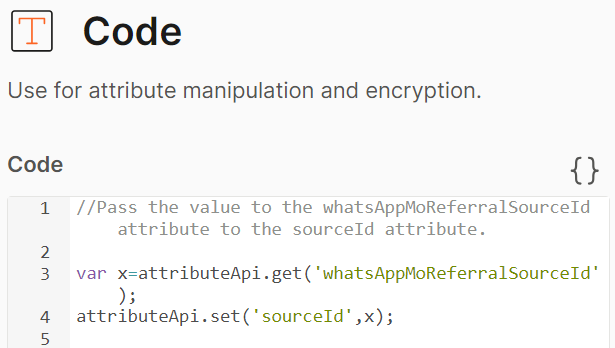
Use the Code element to pass the value of the whatsAppMoReferralSourceId attribute to the Answers attribute that you created. Example: sourceId.
Use the following code.
var x=attributeApi.get('whatsAppMoReferralSourceId');
attributeApi.set('sourceId', x);
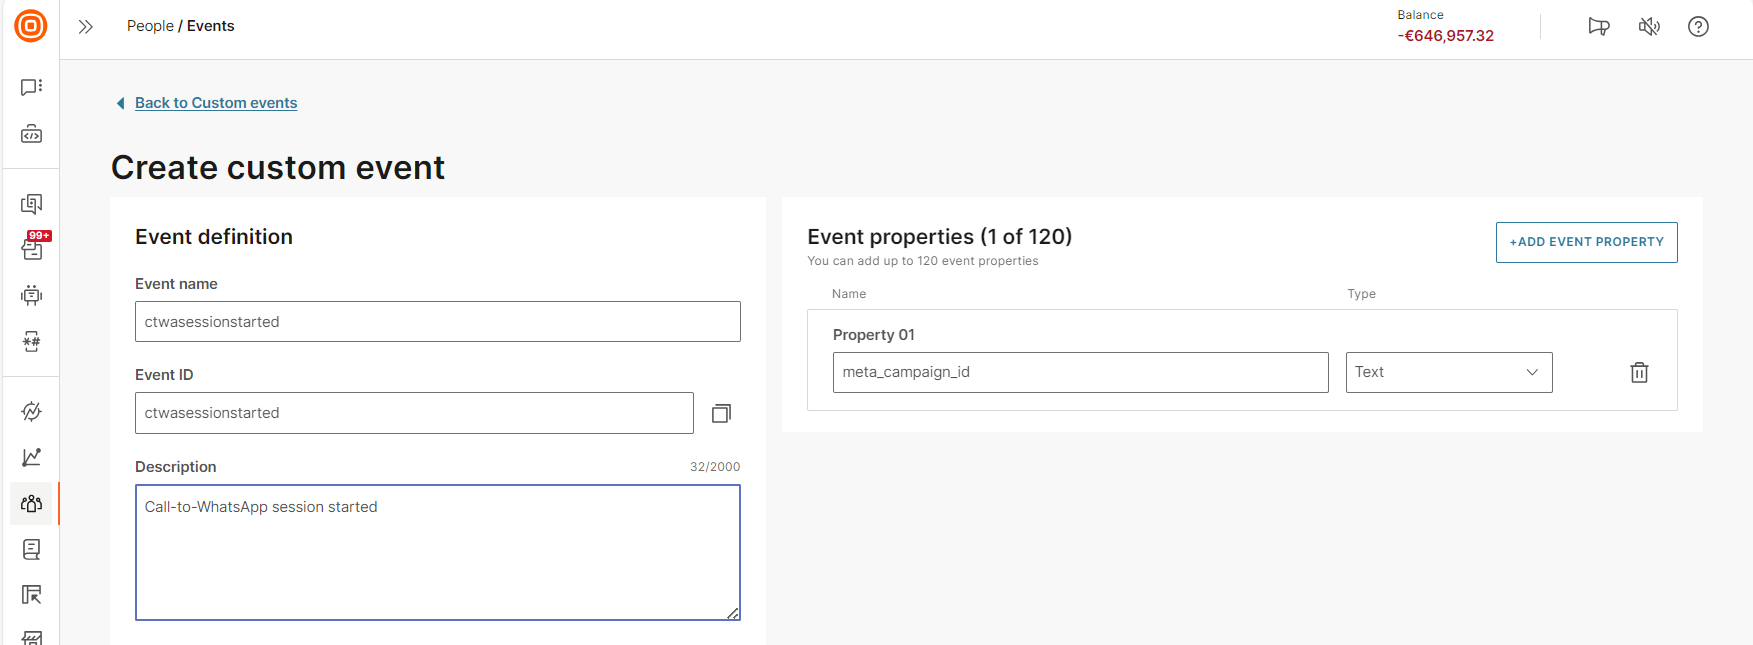
Define ctwasessionstarted custom event [#define-ctwasessionstarted-custom-event-advertising-performance]
To calculate the conversion value, there needs to be information in People about when the chatbot session started. To do this, define a custom event as follows.
- On the Infobip web interface, go to People > Events.
- Select Create event.
- In the Event name field, enter ctwasessionstarted.
- Enter the description of the event.
- Select New event property.
- In the Property name field, specify meta_campaign_id.
- In the Type field, select Text.
Use the same Event name and Property name as described in the instructions in this section.
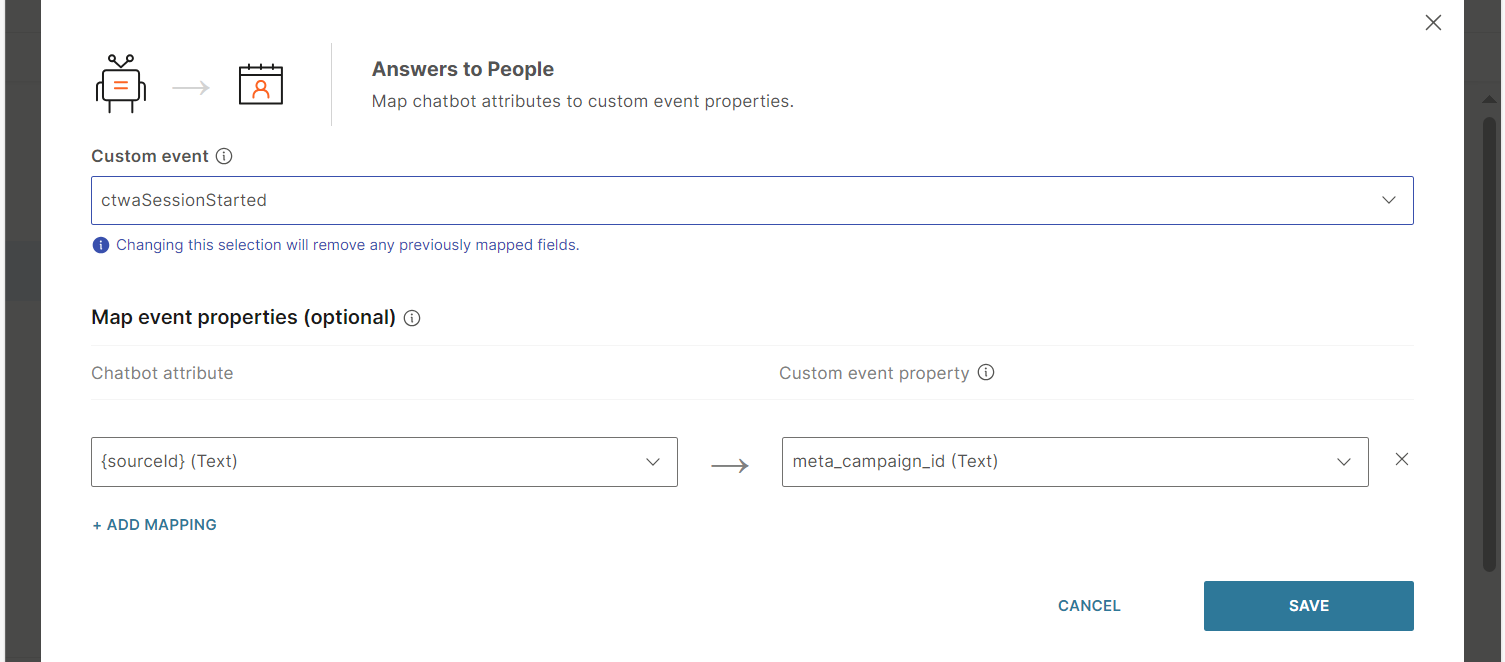
Add People custom event element to chatbot [#add-people-custom-event-element-to-chatbot-advertising-performance]
In the chatbot, add the People custom event element at the beginning of the dialog. In this element, map the Answers session attribute to the meta_campaign_id event attribute.
Set a long session timeout (Optional) [#set-a-long-session-timeout-optional-advertising-performance]
To avoid discrepancies in analytics, set up a long session timeout. Example: 24 hours.
Performance graph [#performance-graph-advertising-performance]
Select the following filters to view the analytics.
- Campaign: Name of the campaign for which you want to view the analytics. Only campaigns that have a click-to-WhatsApp entry point are listed.
- Target event: Event that you want to track. Example: Added to cart, checkout started, purchase, lead created, or user registered.
- Conversion value: Value of the conversion. Example: Total revenue obtained from conversions or the number of conversions.
- Time period: Select a predefined time period.
Meta advertising metrics [#meta-advertising-metrics-advertising-performance]
View information about your ad campaigns. Use the filter and search options to view specific results. The information is displayed for the time period that you selected in the performance graph.
- Campaign name: Name of the ad campaign that has a click-to-WhatsApp entry point.
- Campaign ID: Unique identifier of the campaign in your Meta ads manager.
- Spent: Total cost of the campaign in the selected period.
- Impressions: The number of times end users viewed the ad.
- Clicks: The number of time end users clicked the ad.
- New profiles: The number of end user profiles that were created in People because of the campaign.
- Conversions: The number of target actions that were taken by end users within the last 7 days. Example: purchase.
- ROI: The revenue generated (Conversion value) to the cost of the campaign (Spent), displayed as a percentage. The ROI shows the efficiency of the ad campaign.
Export analytics data [#export-analytics-data-advertising-performance]
To export the analytics data in .csv format, select Export report.