How-to
The how-to section offers practical, step-by-step instructions for working with analytics in Conversations. Here, you will learn how to:
- Drill into data for deeper analysis
- Export dashboards for sharing or offline use
- Sort and filter analytics details
- View detailed reports and visualizations
- And more
Use these guides to efficiently navigate analytics features and gain actionable visualizations for your contact center.
Drill into data
After you add a visualization to the dashboard, you can configure drilling for that visualization. Drilling is not available for KPIs.
You can drill into the following targets:
- Visualization
- Dashboard
- URL
After you configure drilling, clicking a fact, metric, or attribute in View mode opens the target visualization, dashboard, or URL. You can set up multiple drilling options for the same visualization. For example, you can configure drilling into both a visualization and a dashboard.
Configure drilling [#configure-drilling-drill-into-data]
- Select the visualization to view the menu options.
- Select Interactions → Drill interactions → Add interaction.
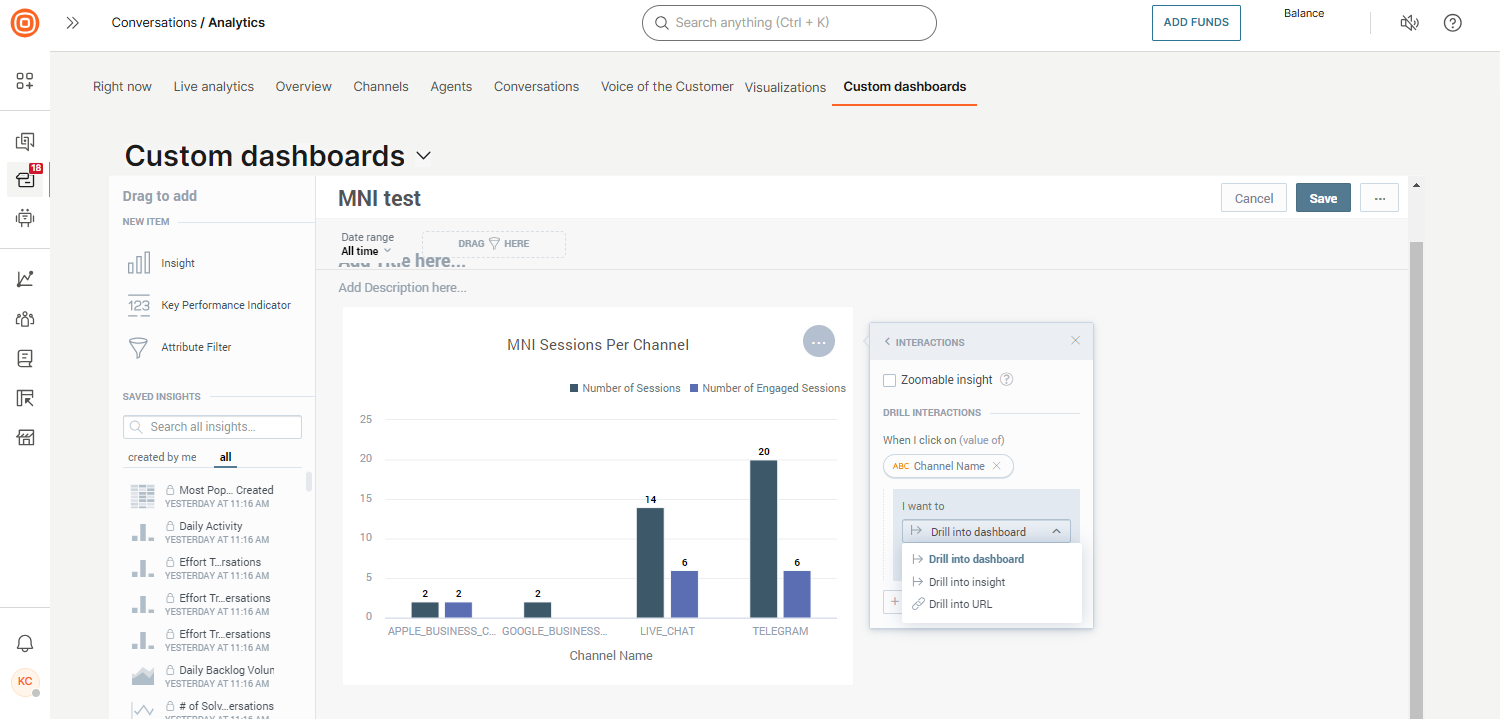
- Choose the data item for which you want to drill.
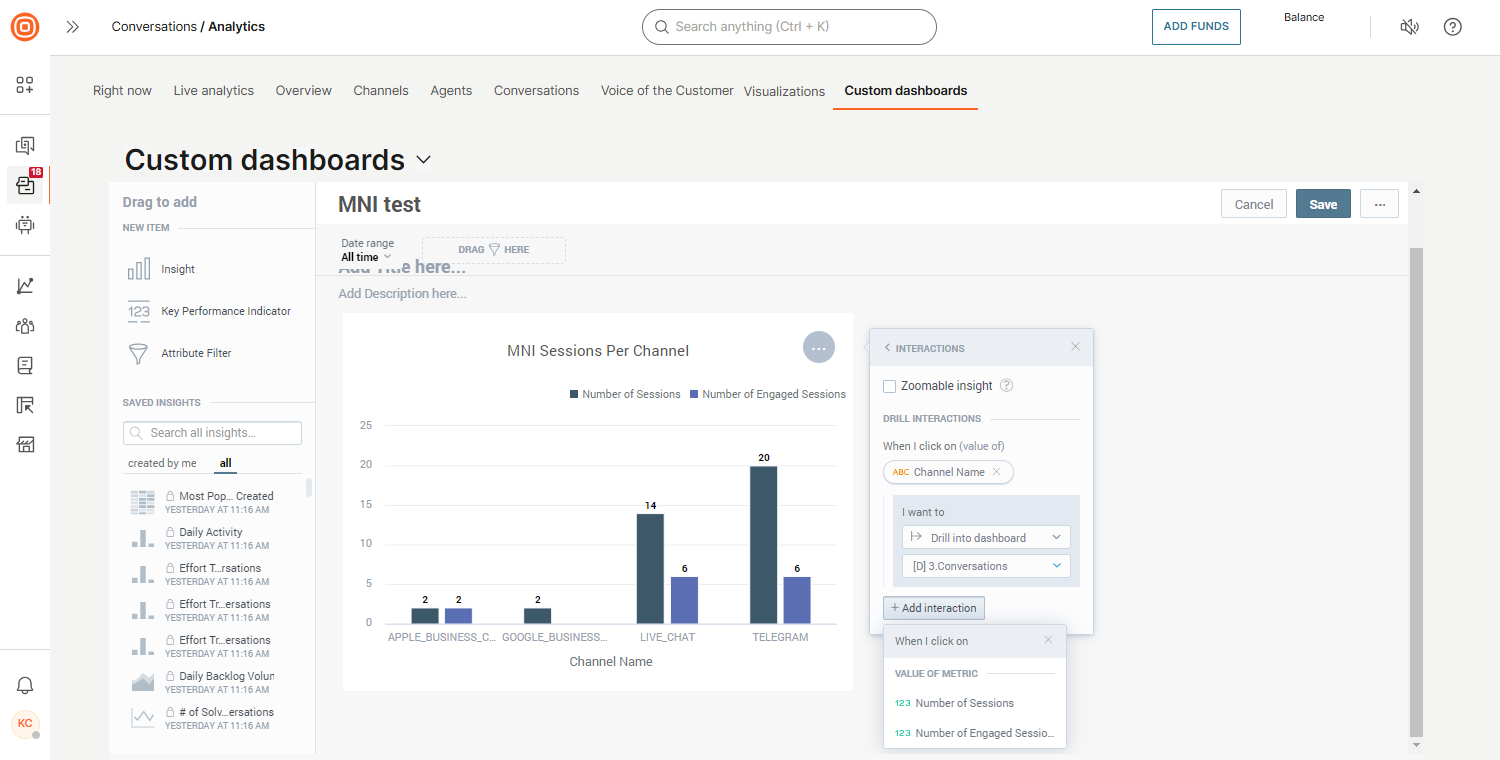
- In the I want to section, choose whether you want to drill into an visualization, another dashboard, or a URL.
- Drill into dashboard: Choose an existing dashboard. You can select dashboards that you created or that are shared with you.
- Drill into visualization: Choose the visualization to which you want to drill. You can select visualizations that you created or that are shared with you.
- Drill into URL: Either choose an existing URL or create a custom URL.
- Click Save.
View results [#view-results-drill-into-data]
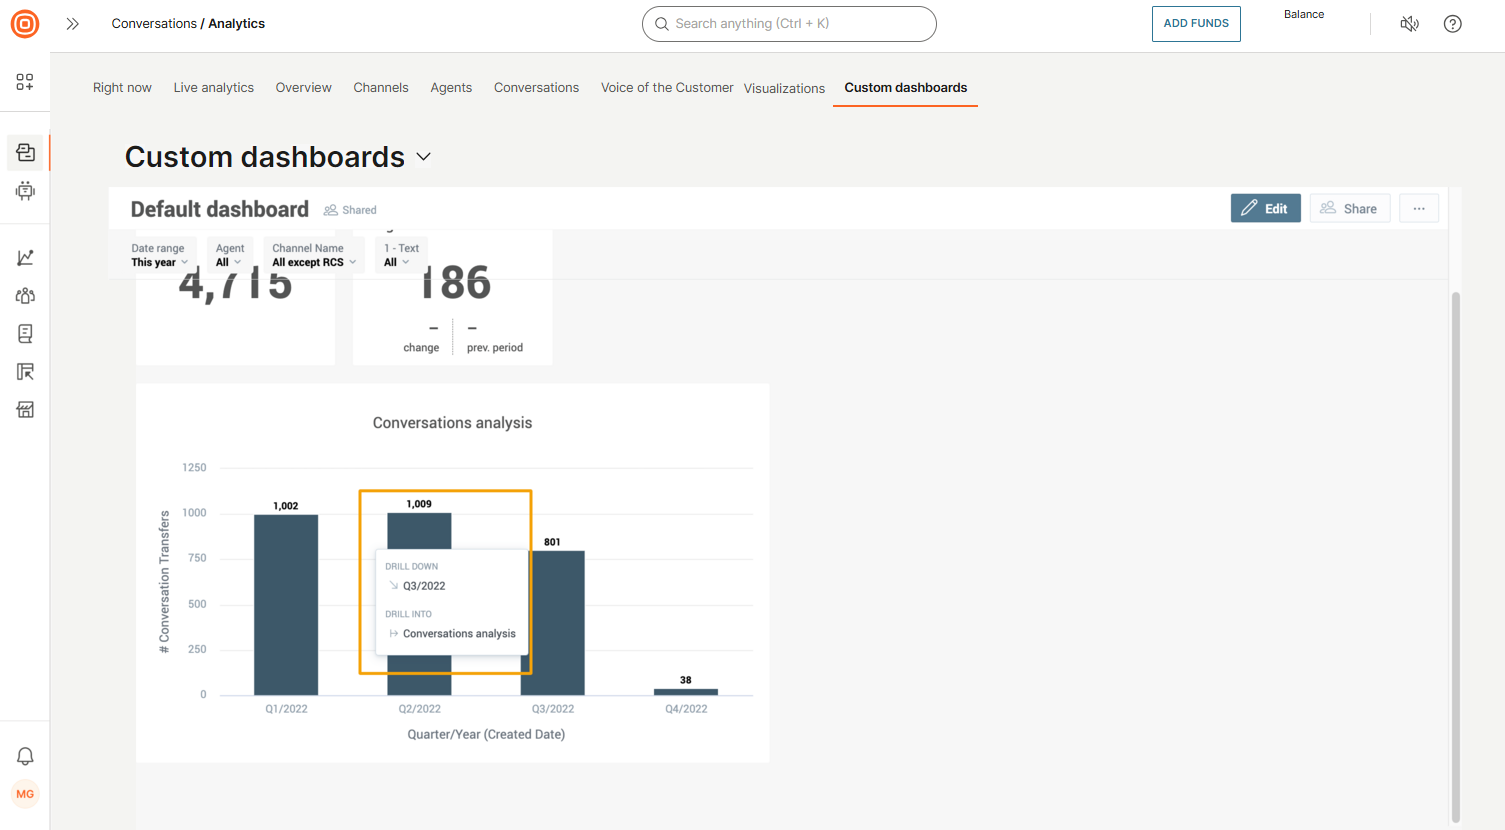
- On the dashboard, go to the visualization.
- Click the item into which you want to drill. Then, click an item in either the Drill down or Drill into sections.
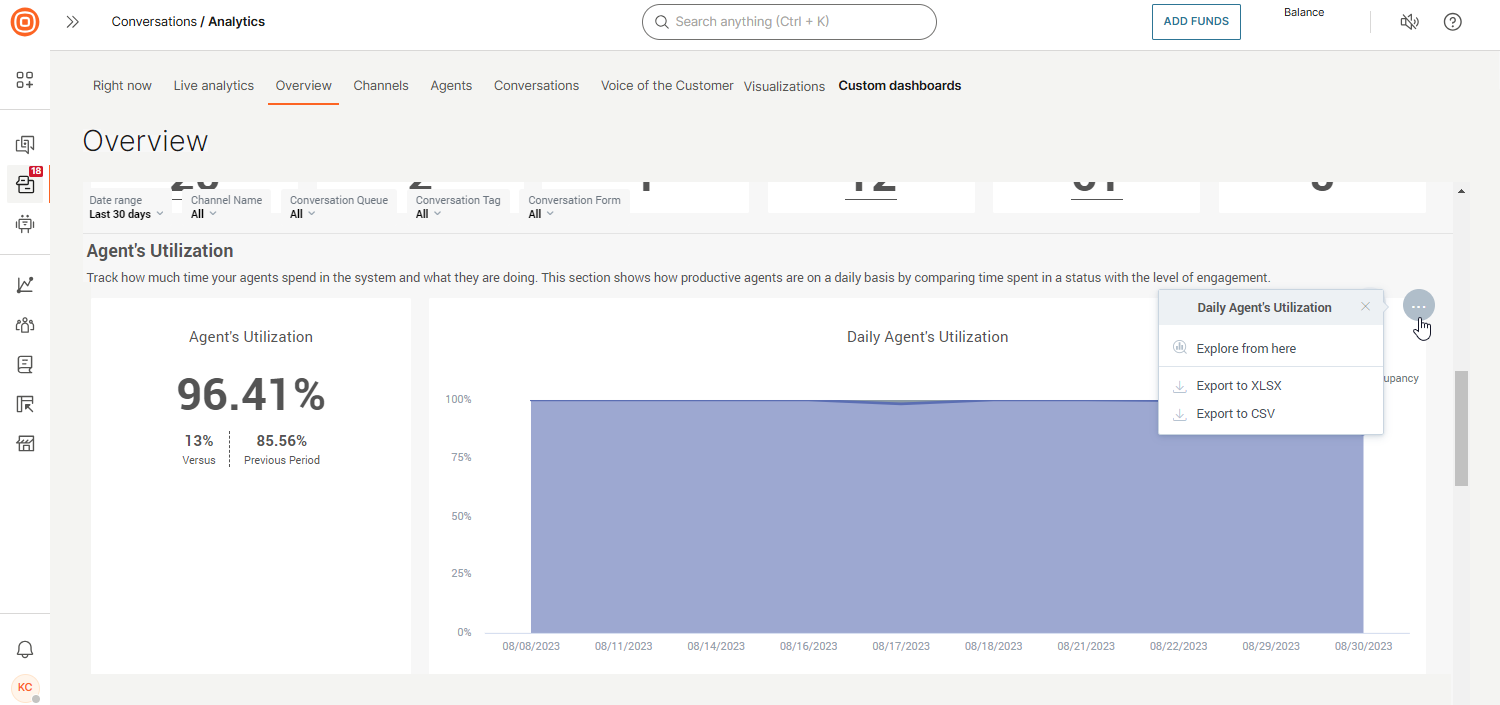
Export a dashboard
To export a dashboard, click the three dots against the dashboard and choose one of the following file formats:
- .csv
- .xls
The dashboard is downloaded as a static file.
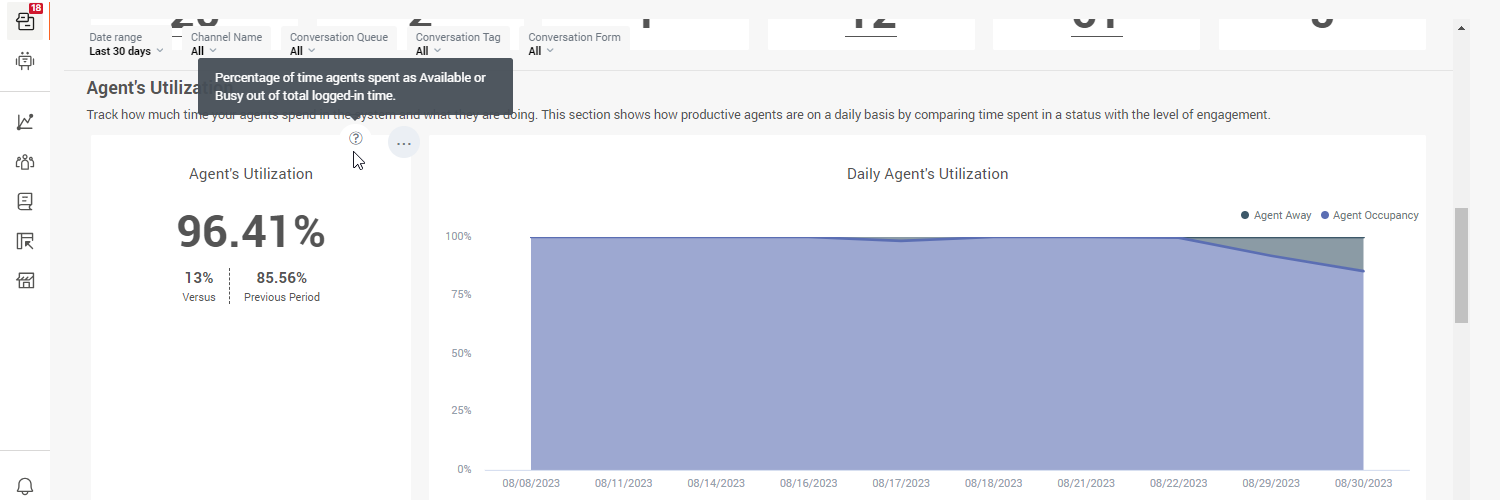
View graph details
Hover over the question mark icon for more information about the graph.
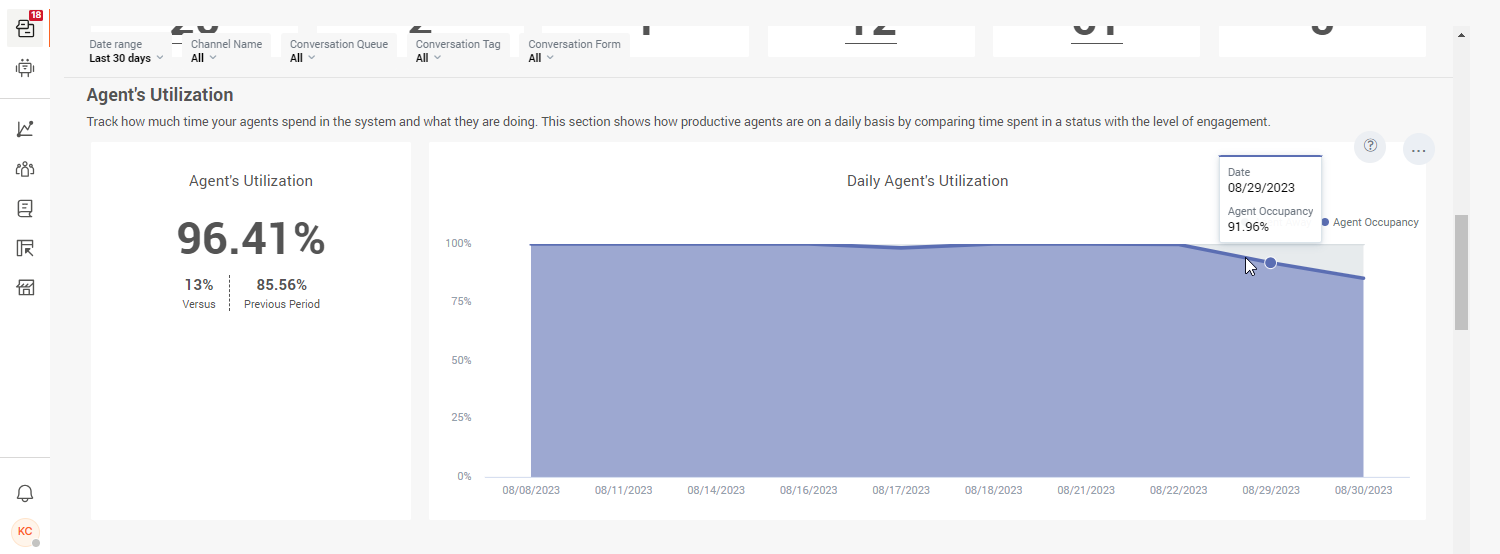
View data point details
Hover over a data point in the graph for more information.
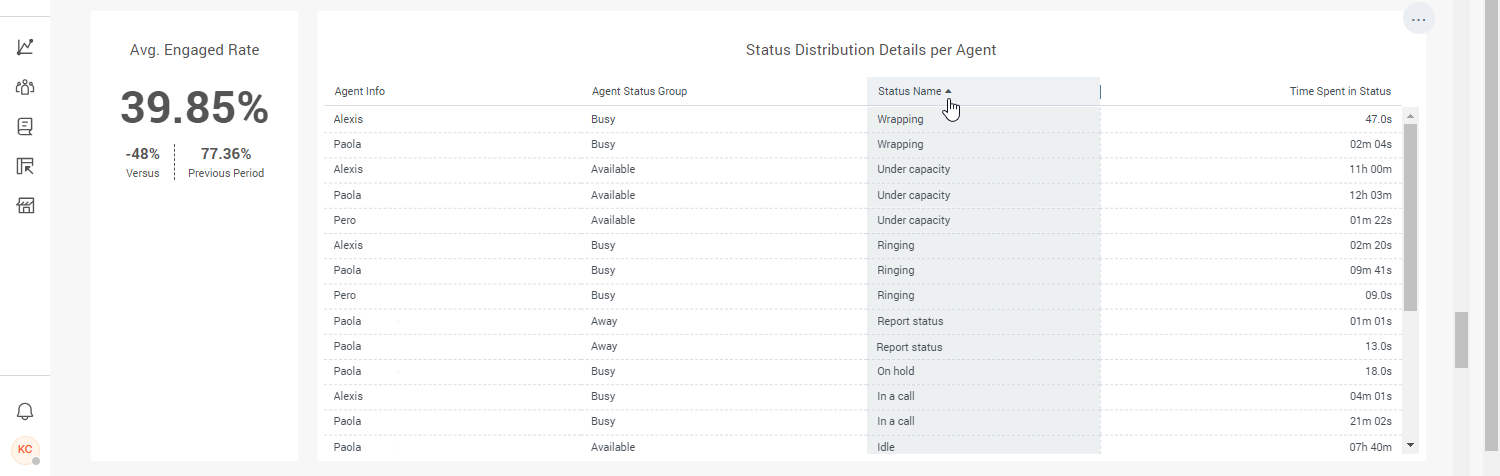
Sort data in tables
To sort the data in a table, click the relevant header.
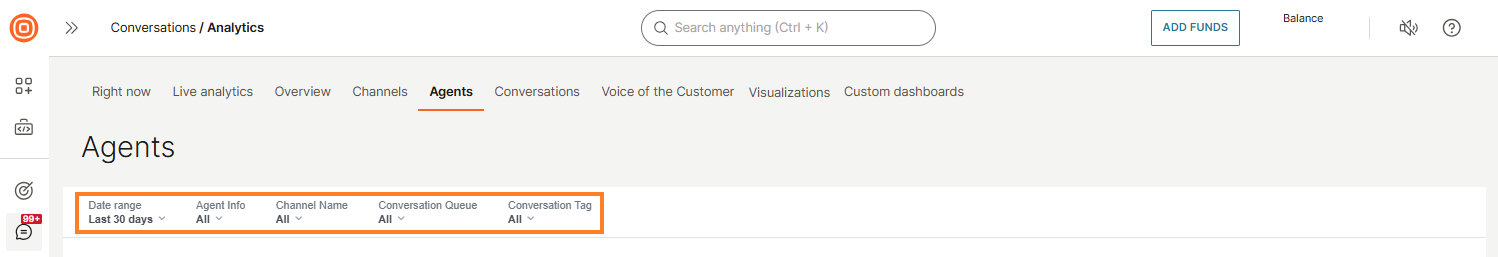
Filter data
You can utilize the filters located at the top of each page to filter the displayed data according to your chosen criteria. Note that the specific set of filters may vary from one page to another.
Show or hide data in graph
You can hide data so that only the required data is visible in the graph.
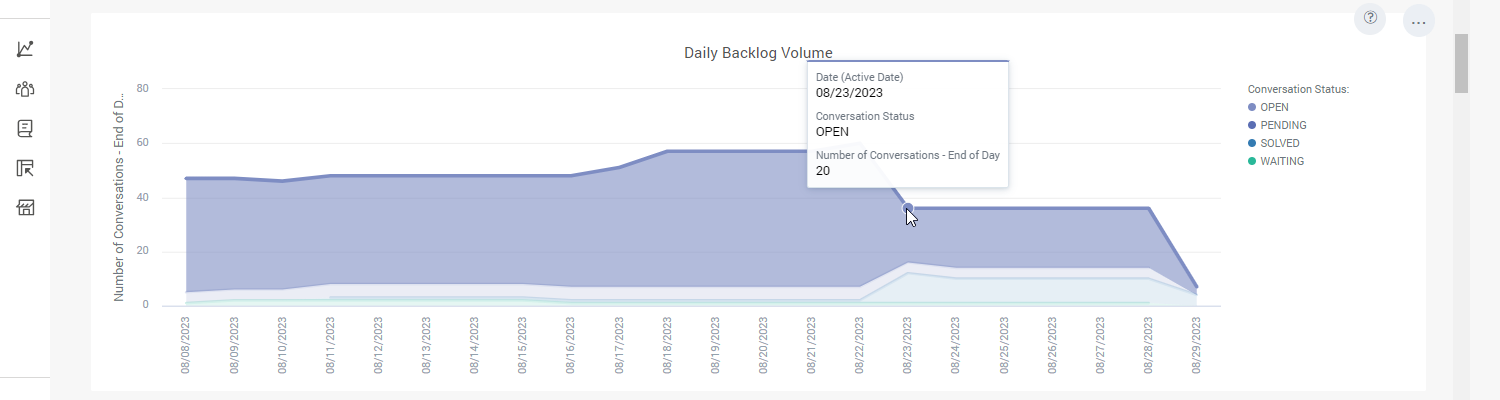
In the key next to the graph, click the items that you want to hide. Similarly, to add this data back, click the items again.
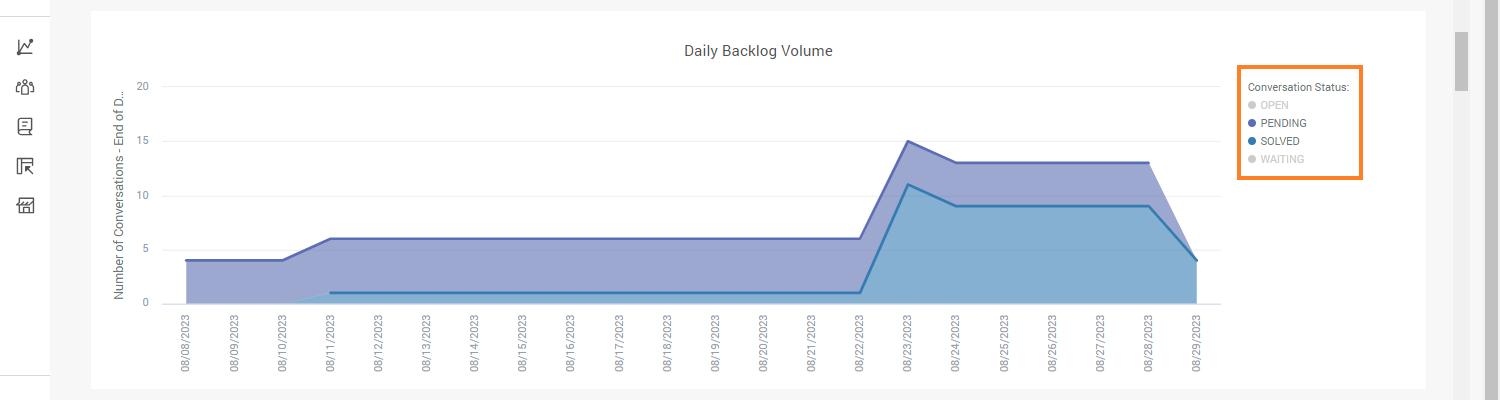
You can also hover over a data point in the graph to highlight the entire set of data. Example: In the following image, hovering over a data point in the Conversation Status: OPEN graph highlights only that graph.