Right now
The Right now dashboard displays the current state of your Conversations contact center. All key indicators are consolidated to give you a clear view of ongoing events. You can filter data by channels and queues using the options on the far right.
Data updates each time you refresh the page to show the most up-to-date analytics.
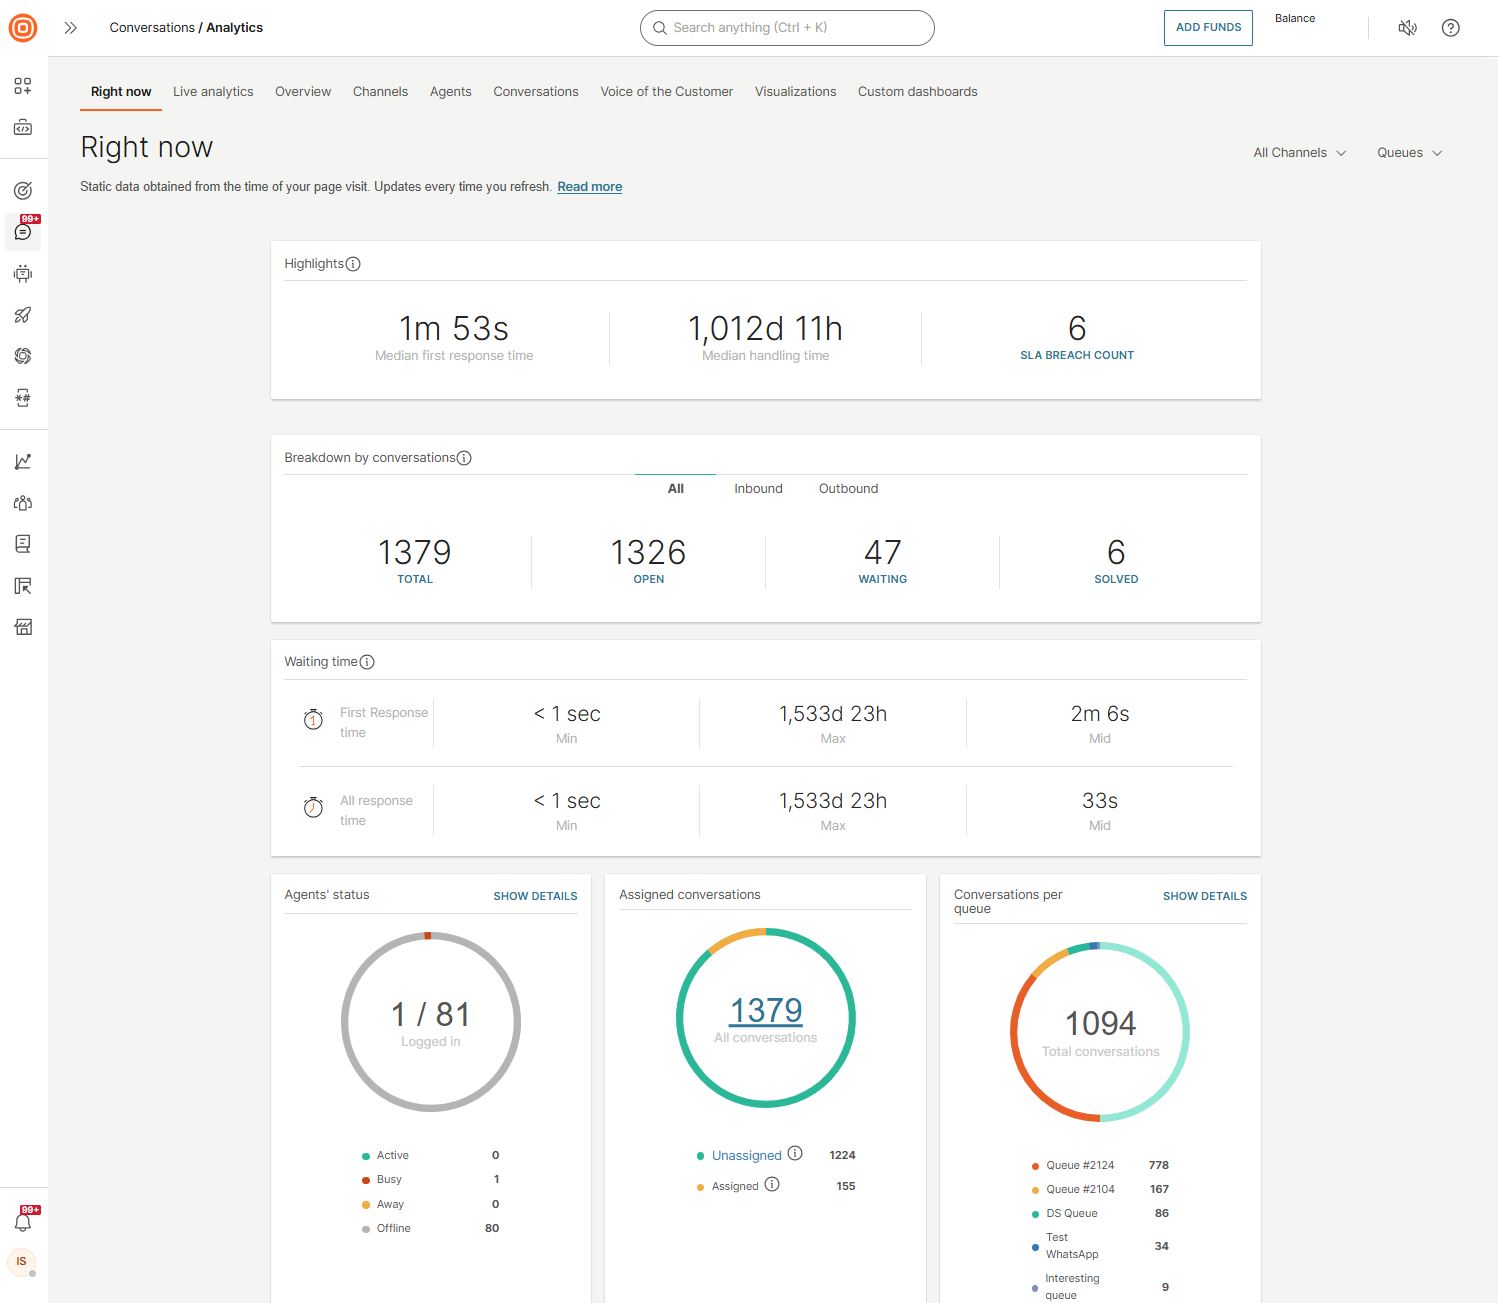
Highlights
View the current distribution of active conversation statuses and the performance of all queues. This section also shows the number of active conversations with a service-level agreement (SLA) breach.
Breakdown by conversations
See how many active conversations are in each status (Total, Open, Waiting, Solved). You can filter by origin:
- All
- Inbound
- Outbound
Waiting time
Understand how long customers are waiting for your services. Filter results by selecting a specific channel from the channels list in the upper right corner.
Metrics available:
- First response time: Time taken by an agent to respond to a conversation, measured from creation until the agent’s first message.
- All response time: Median time taken by an agent to respond to all messages (excluding the first message).
Both metrics display minimum, maximum, and median values.
Agent status
Shows the number of currently logged-in agents compared to all agents. View agents by status (Active, Busy, Away, Offline). Select Show details to view all agents. You can export the full list by clicking Export and selecting the .CSV option.
Assigned conversations
Displays all currently active conversations, including counts for unassigned and assigned conversations.
Conversations per queue
Shows the total number of conversations by status for each queue. Select Show details for more information.
Top most used tags
Displays the most used tags in active conversations, ranked by usage. Select Show details to see tag performance. You can export this list as a .CSV file.
Performance per channel
Shows how active conversations are distributed by status for each channel.