Analytics
Introduction
Here is where you will find the information on how your chatbots are performing and where you can get the statistical data for your chatbots.
Answers analytics consist of 4 different tabs to make it easier to assess different kind of information:
- Overview – combines information from all other tabs and gives a quick overview of the number of messages and sessions
- Session analytics – displays in-depth session information
- Conversational analytics – analyzes messages exchanged between the end user and the chatbot
- User analytics – shows end user data in chatbot communication, including CSAT results (if available)
Depending on your Answers package, the following Analytics dashboards are available in your account:
| Dashboard | Start/Starter Package | Grow/Enterprise Package | Scale Package |
|---|---|---|---|
| Overview | Yes | Yes | Yes |
| Session analytics | Yes | Yes | Yes |
| Conversational analytics | No | Yes* | Yes |
| User analytics | Yes | Yes | Yes |
| * Intent analytics are not included | |||
Overview
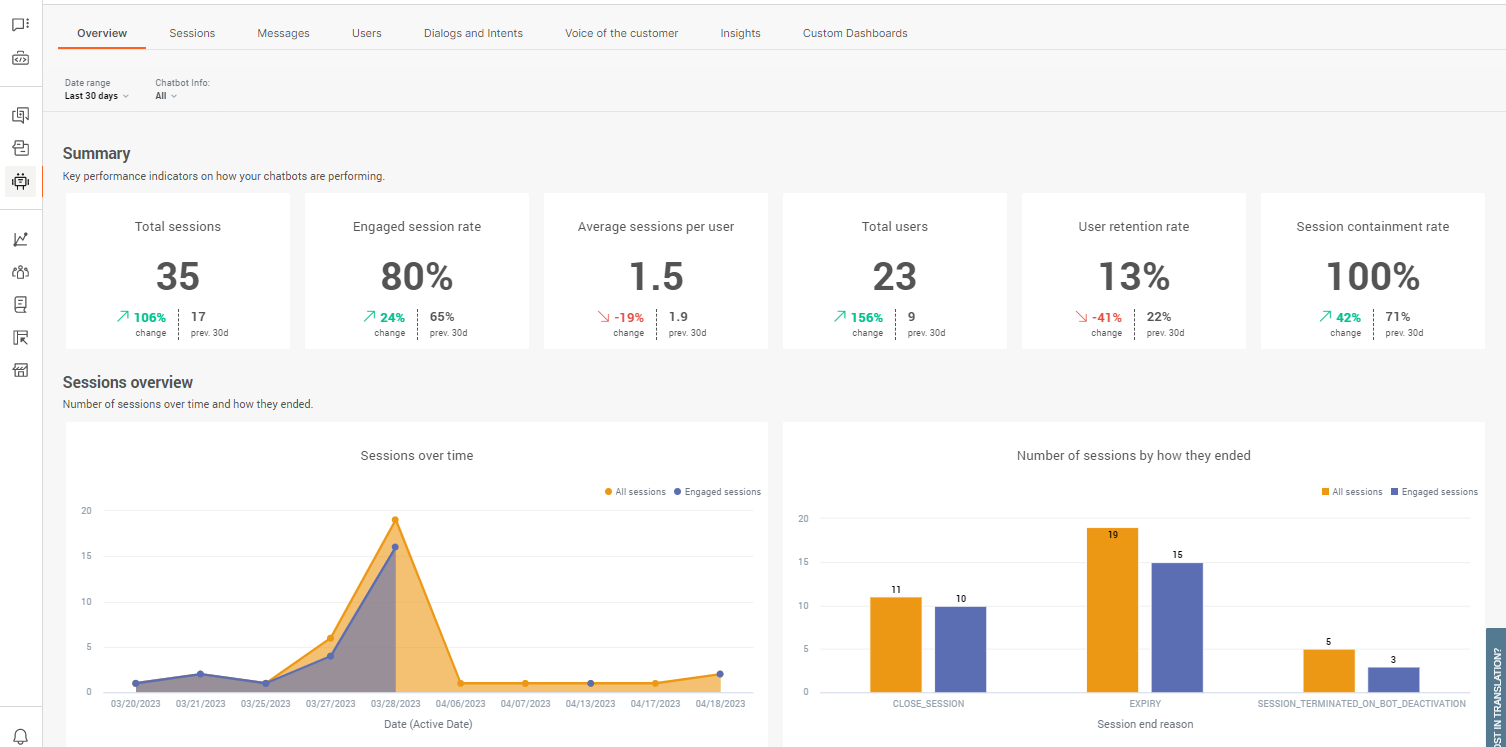
On the Overview page you will find the following information:
- Sessions summary
Displays the difference between total sessions and engaged sessions, average sessions per user and clearly delineated the number of chatbot users vs number of engaged users
- Sessions timeline graph
Gives a graphical overview of your total sessions, average sessions per user, and number of users over time, so you can spot peaks, follow growth, and adequately plan your resources.
- Message summary
;See the number of inbound and outbound messages exchanged, and easily toggle “engaged sessions” to see the number of inbound and outbound messages for engaged sessions only to learn how long the conversations last
- Information about Messages and sessions per each chatbot
Check which of your chatbots performs the best, i.e. has the highest number of sessions.
Also, use it to quickly compare the number of users with number of sessions to see which chatbots engage users more (meaning their conversational design is probably better than the rest of the chatbots).
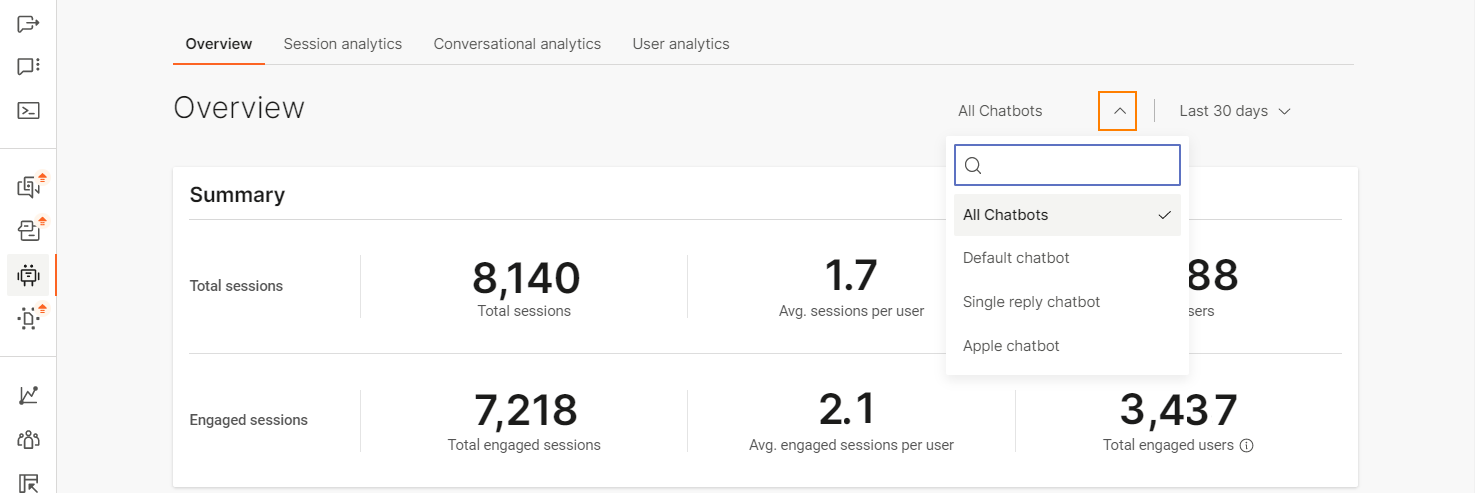
You can choose to see the session summary for all chatbots or for a particular chatbot.
An engaged session is one in which an end user initiated the session and then sent a minimum of 1 message to the chatbot.
To select one chatbot, use the All Chatbots dropdown list and select the chatbot you are interested in.
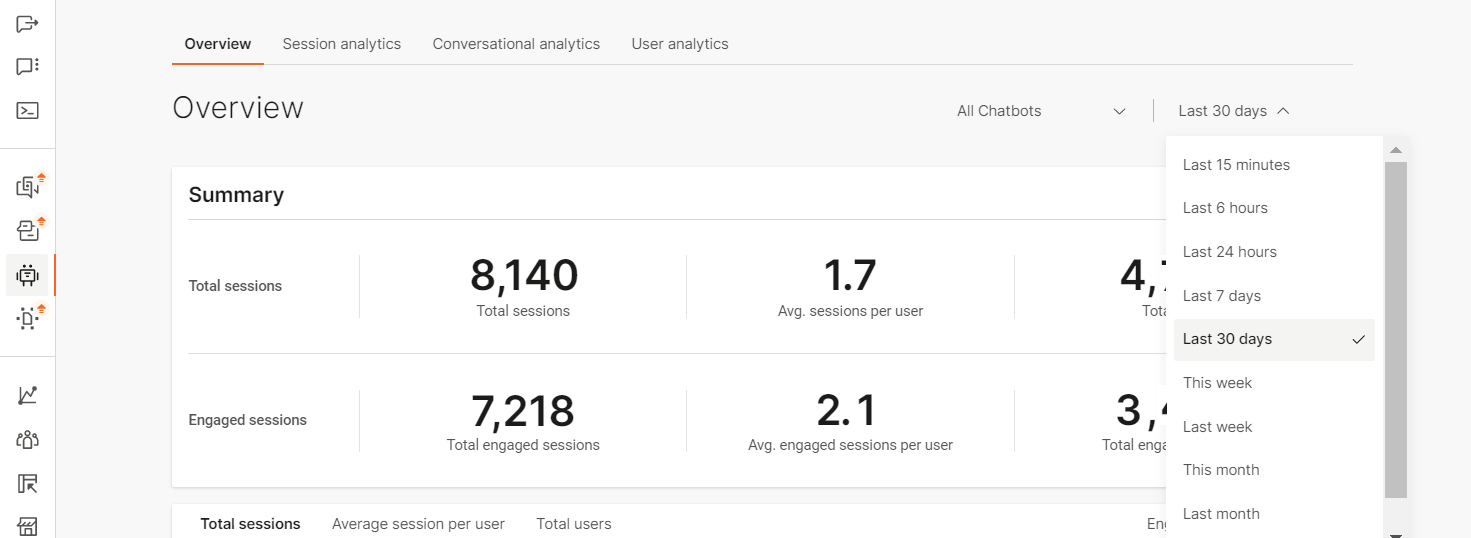
Additionally, you can select to see the information for a specific time period. Last 30 days is the preselected date range, but you can choose among other options from the list.
If any of the provided date ranges are not what you need, use Select rangeto enter the dates you prefer (here you can broaden the time range to include several months):
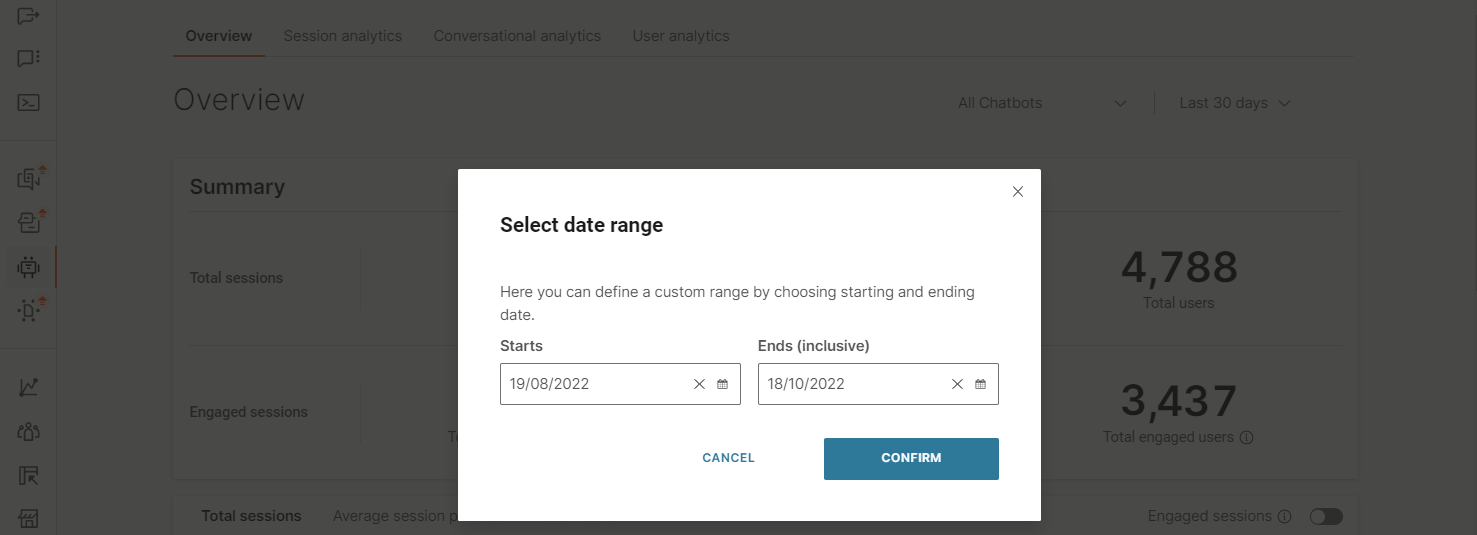
The Overview page will then display the refreshed analytics for your selection.
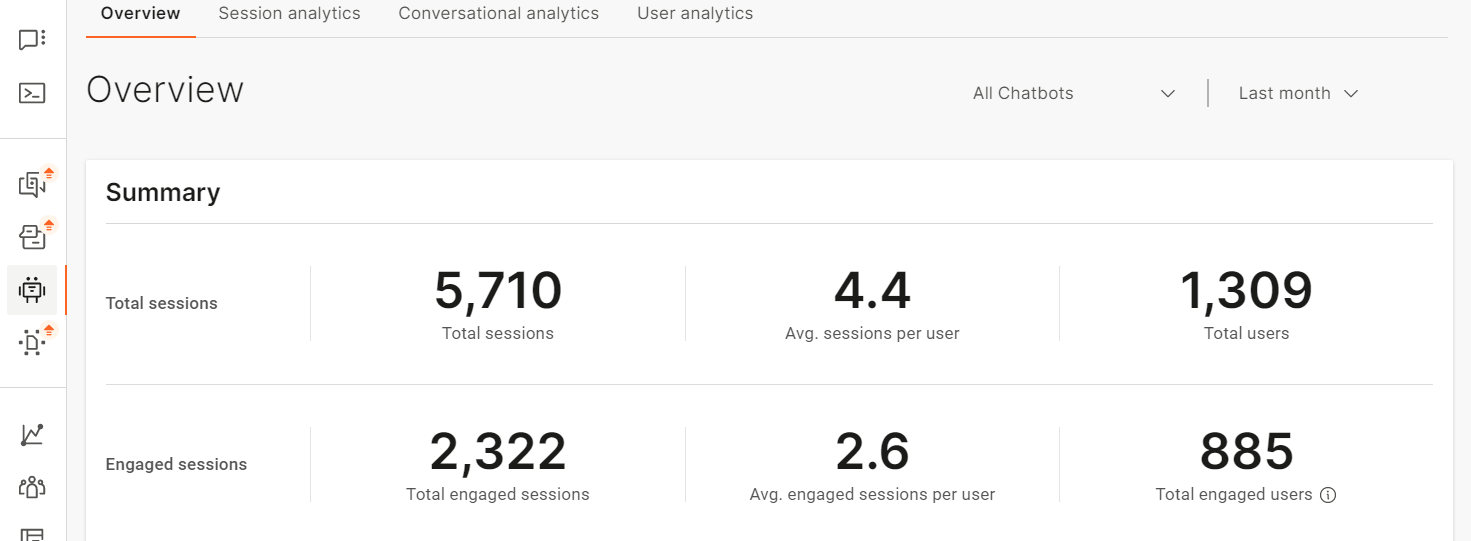
The Summary widget displays the session information divided into total sessions and engaged sessions.
For the sessions (total and engaged), you can see:
- Total sessions number
- Average session per user – total number of sessions divided with total number of users
- Total users number
Check the difference between the total number of sessions and users to see if your users drop off after sending the first message to the chatbot. You want the difference between the total number of users/sessions and engaged users/sessions to be minimal as that means that your end users like to engage in the conversations with the chatbot. The higher the difference, the less engaging your chatbot is. To improve the engagement, check the conversational analyticsand what are the glitches that possibly happen during conversations.
The Sessions timeline graph gives a graphical overview on how the sessions performed during a certain time period.
The sessions are separated into three tab options:
- Total sessions
- Average session per user
- Total users
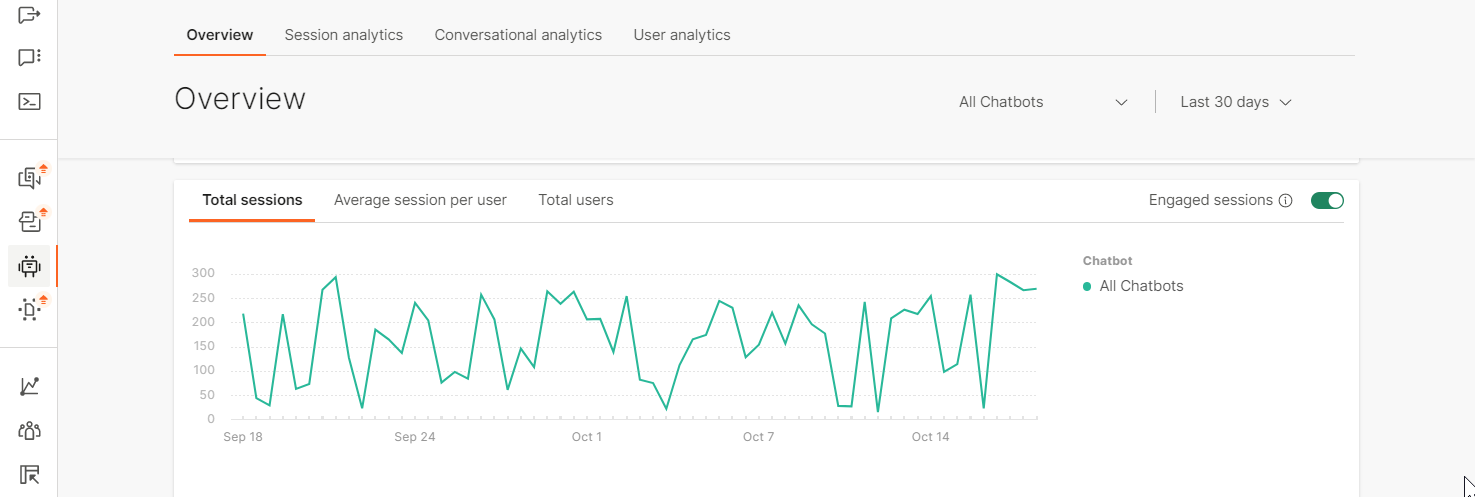
Use the graphical overview to check the peak times for conversations. Positions the mouse anywhere on the graph to get the information for that particular point in time. This graph lets you see peak times of user engagement and this can help with activity planning in promotional activities. The widget also shows the same type of information for Engaged sessions so you can compare if some periods are better for user engagement, when they talk more with the chatbot.
Messages and Users widgets have the option to show you the information either for all sessions (default) or for Engaged sessions.
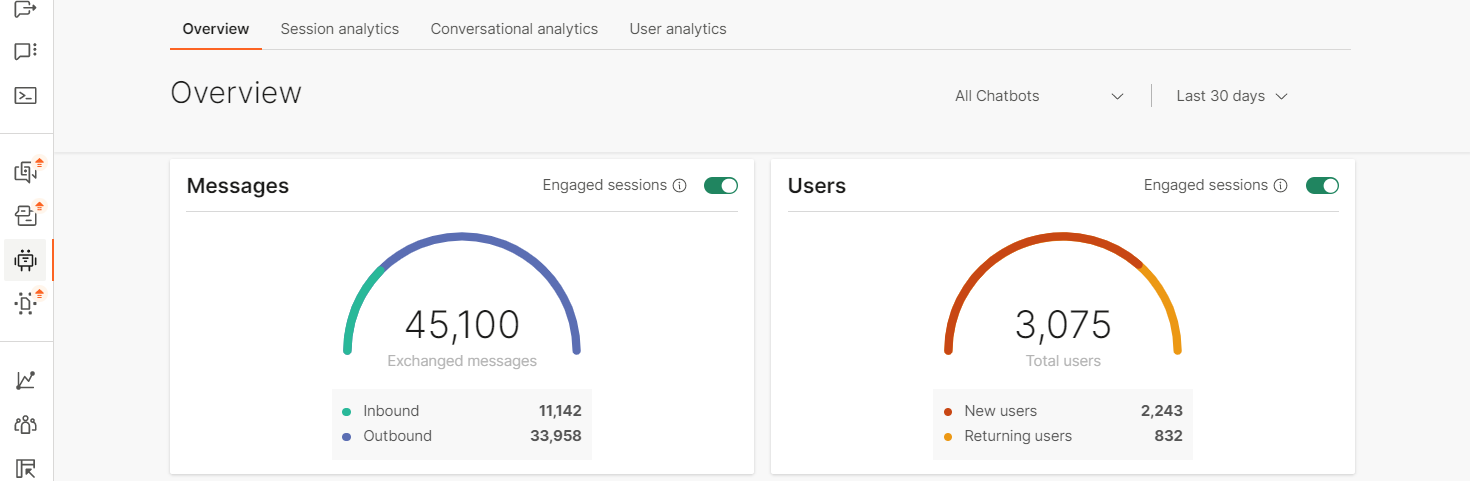
The chatbot information displayed here depends on the selection you made in the All Chatbots list.
This widget will help you see how balanced your conversations are (inbound and outbound messages are close to one another), and how many users return to chatbot conversation. Of course, this will depend on the type of chatbot you have. If you have a chatbot that deals with promotions and retail, you want to see returning users. If your chatbot handles customer issues, then you probably don’t want your users to return often.
Sessions and messages per chatbot widget displays the following:
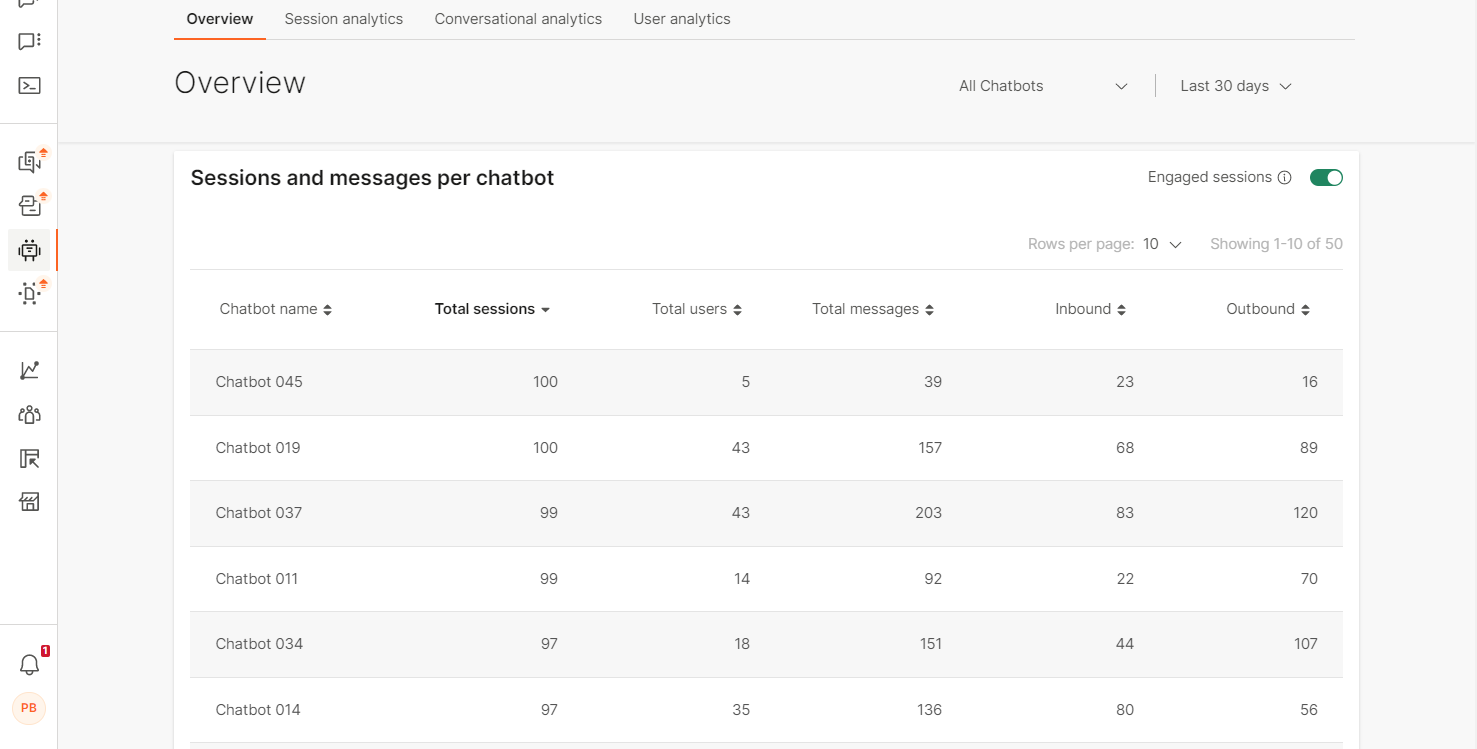
- Chatbot name
- Number of Total sessions – number of started sessions
- Total usersnumber – number of distinct users who started a session with the chatbot
- Total messages number - all the messages exchanged between the bot and the end user
- Number of Inbound messages - number of messages sent by the end user
- And number of Outbound messages - number of messages sent by the chatbot
The number of total messages is the sum of inbound and outbound messages.
Compare how your chatbots perform, which ones have the most sessions, which ones have the most users and where do conversations happen (the chatbot with the most messages). To get the details of what might influence these alternatives, take a deeper look at conversation analytics.
Session analytics
Session analytics shows the breakdown of information on how the sessions performed.
It uses different widgets which display:
- Session summary
Quick overview of Total vs Engaged sessions, i.e. shows whether your chatbot engages the end users in conversations
- Sessions timeline graph
Displays the number of sessions through a period of time, and you can see when the sessions peak
- Session expiry reason
Toggle to Engaged sessions to see if there is a difference why one-message sessions end and why engaged sessions end. And whether the expiry reason is the one you planned for your chatbot
- Session duration
Displays session duration, average session time and interaction time. If the interaction time is short but the average session time is long, consider the fact that your end users might be confused as to what the chatbot asks them .
- Sessions drilldown
Gives a detailed drilldown into each user session, how long it lasted, how many messages were exchanged and what was the session expiry reason. Sort by any column to see the information displayed by different priority
- API Calls
Overview of all API calls in one chatbot. Gives a clear picture of whether the calls return expected values and how well they execute (the execution time in milliseconds)
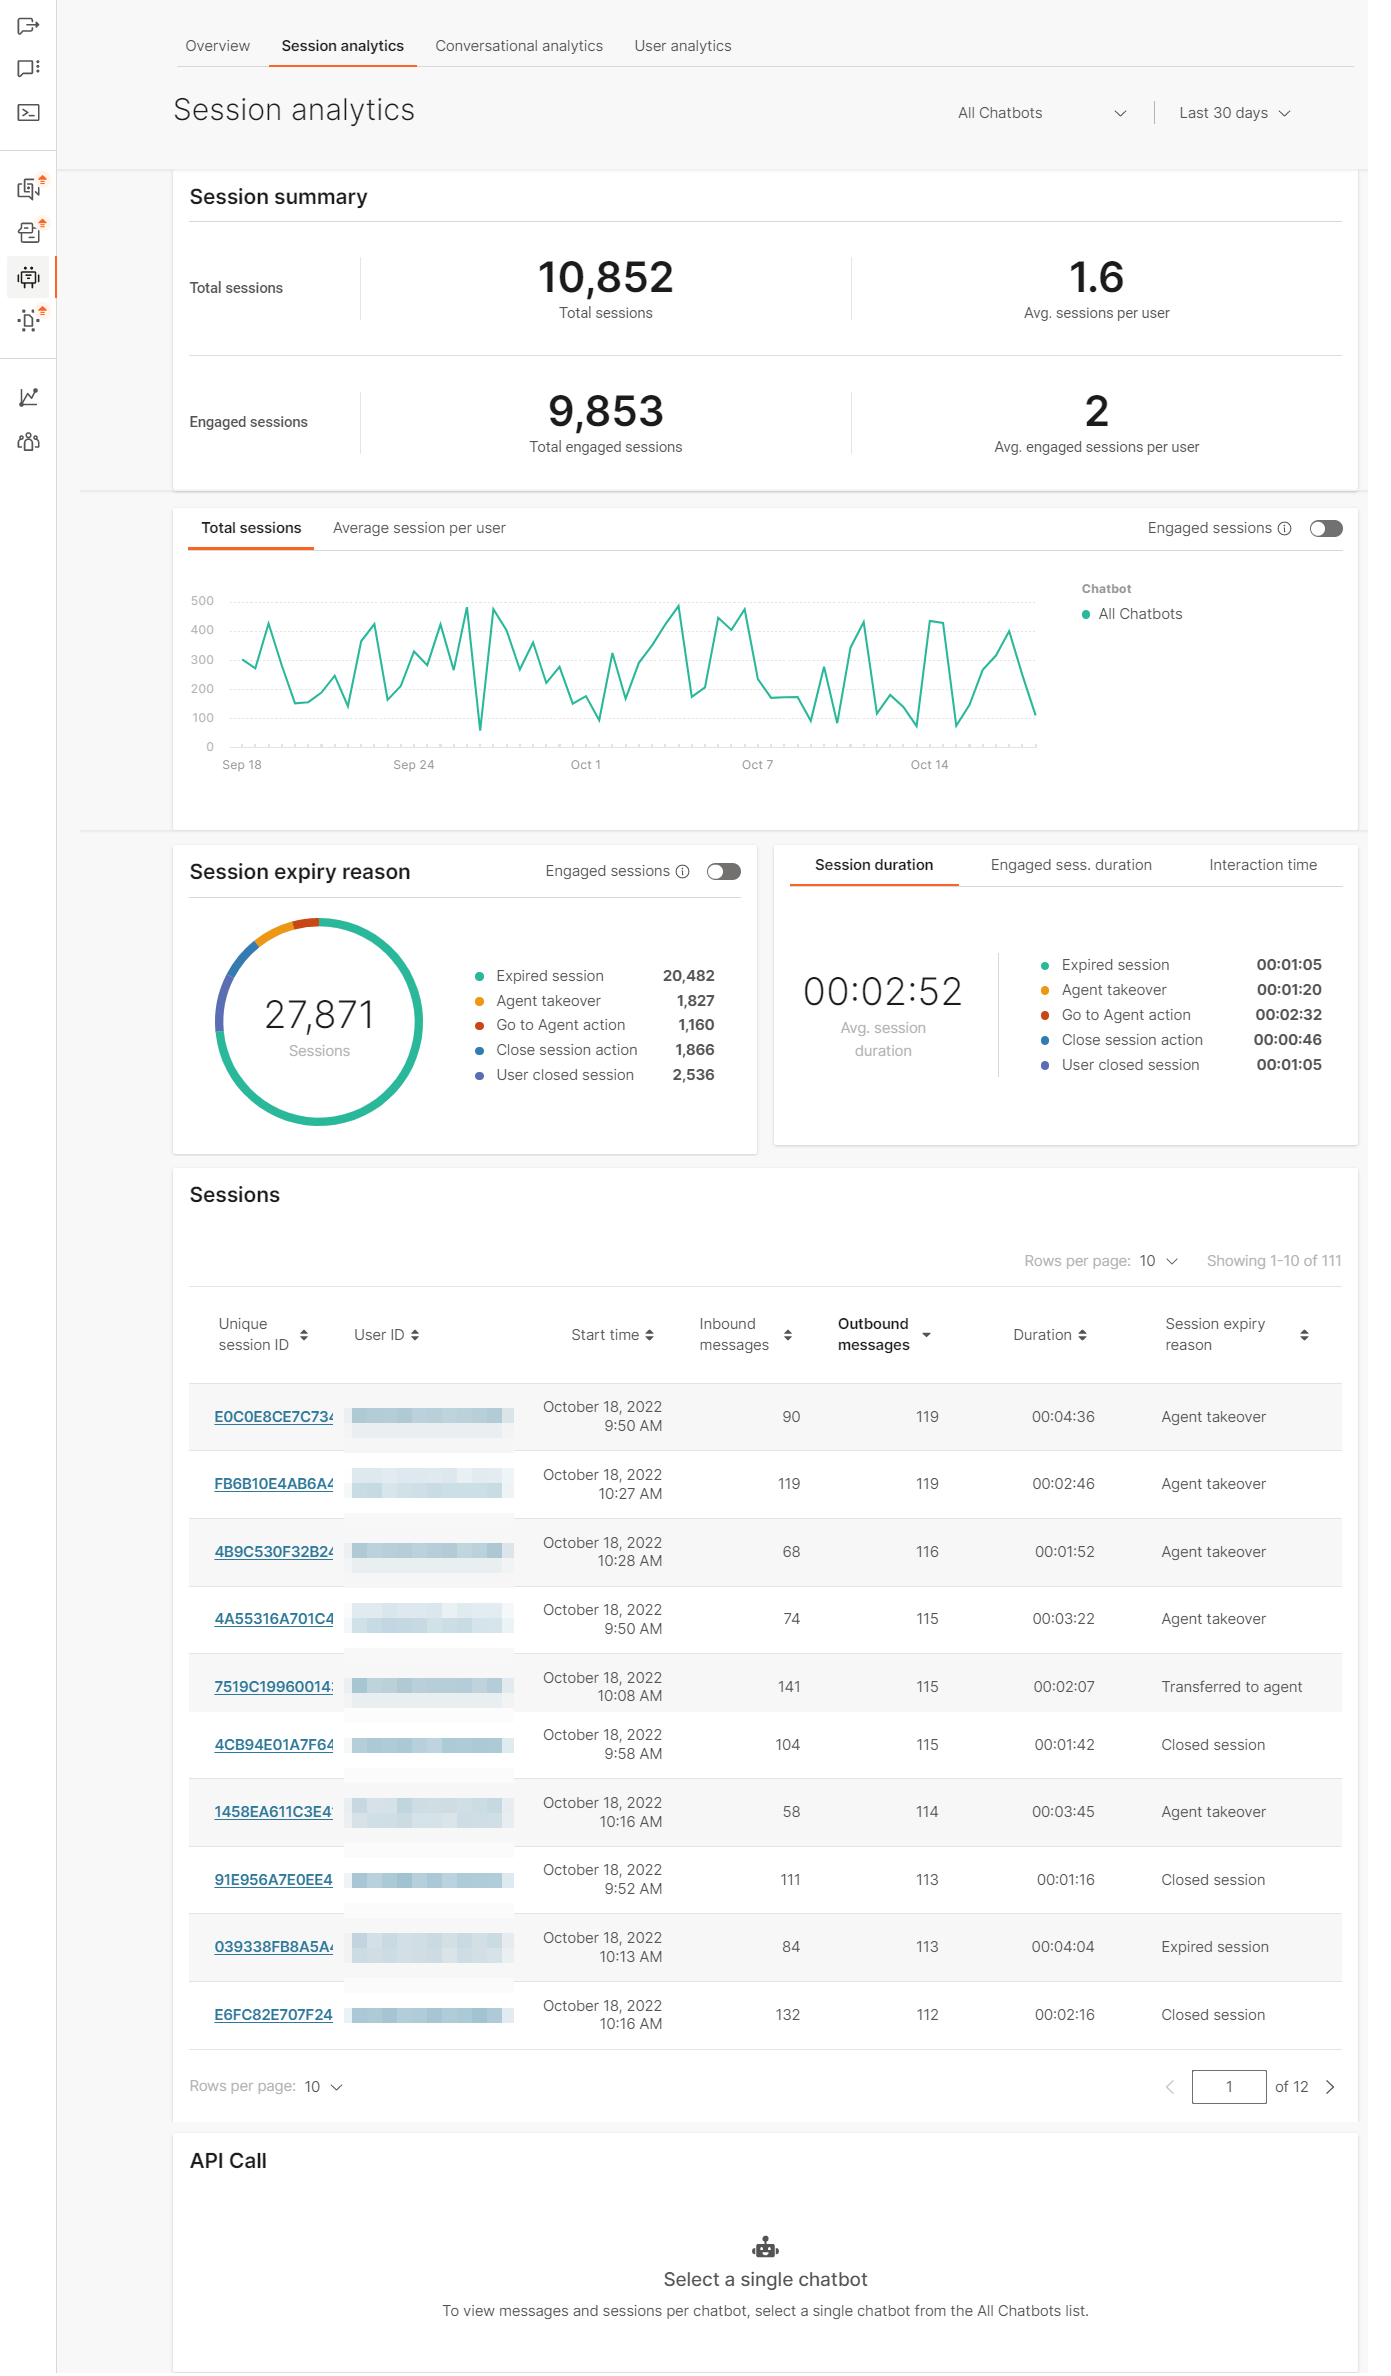
The first graph shows the total number of sessions and the engaged number of sessions.
- Total sessions with
Number of Total sessionsand
Average sessions per user (total sessions divided with the number of users)
- Engaged sessions with
Total engaged sessions and
Average engaged sessionsper user
This summary quickly displays any disparity between the number of total and engaged sessions. Ideally, the number difference between them should be small, meaning all the sessions your users start actually continue after the initial message.
As with Overview tab, the Sessions summary widget is followed by the timeline graph showing sessions throughout the selected period of time.
The displayed timeline depends on the selection you made in the date range dropdown list. Use theEngaged sessions toggle to switch the view to Engaged sessions (it is off by default). Take a look at engaged sessions to see at what periods do your users engage more with the chatbot. This can give you insight into when to schedule certain promotions and expect a better user activity. Also, if you offer agent help with the customer experience, you can use this information to plan for the busy times you see here.
The next widget on the Sessions analytics page displays more in-depth information on sessions. For the Session expiry reason, you can check how your chatbot sessions end assorted in the following categories:
- Expired sessions – meaning the user stopped replying to the chatbot
- Agent takeover – agent follows the conversation and takes it over because the chatbot could not solve the user’s problem
- Go to Agentrequests – the end user requested to talk to the agent and was routed to one
- Close session actions – the conversation reaches the Close session element and is finished
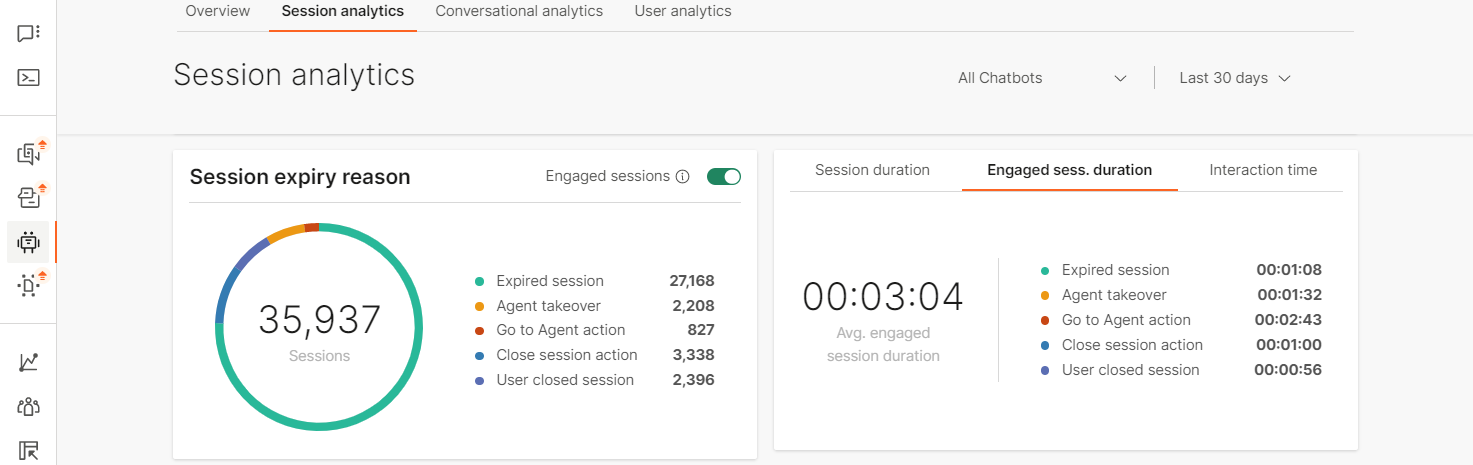
These four types of sessions will always amount to total number of sessions – these are the possible end scenarios for each conversation with the chatbot. Depending on the type of chatbot you have, some expiry reasons should be expected as more common than the others. But, for example, if you notice that agent takeover is too high you can add more intents to cover more scenarios (additionally train the bot).
The Sessions duration widget allows you to check different session information:
- Session duration – calculated for all sessions, engaged or not
- Engaged session duration – how long do engaged sessions last
- Interaction time – how much time the user actually spends in conversation with the chatbot
Use session duration information to learn how long do the sessions last. In case the interaction time is low and engaged session duration high, this might point to your end users not understanding what is expected from them. You can check the unrecognized intents section and see where there is a possible mismatch.
Depending which tab you select here, each tab will also display the session expiry reason breakdown:
- Expired sessions – meaning the user stopped replying to the chatbot
- Agent takeover – agent follows the conversation and takes it over because the chatbot could not solve the user’s problem
- Go to Agentrequests – the end user requested to talk to the agent and was routed to one
- Close session actions – the conversation reaches the Close session element and is finished
The Sessions drilldown widget is useful to check the particulars of each session. For each session you can see the following information:
- Unique session ID - unique ID for the session. Format: UUID4. Example: bbd86e7a-47a6-4fba-8d67-1c8cfeb62b22. The ID is independent of the end user. Example: if an end user initiates two chat sessions with a bot, two unique IDs are generated, one for each session.
- User ID - depends on the channel where the chatbot is deployed. Example: phone number
- Start time – when the end user sent the first message
- Number of Inbound messages – messages sent by the user
- Number of Outbound messages – messages sent by the chatbot
- Duration
- Session Expiry reason – one of the 4 available ways that the session can end
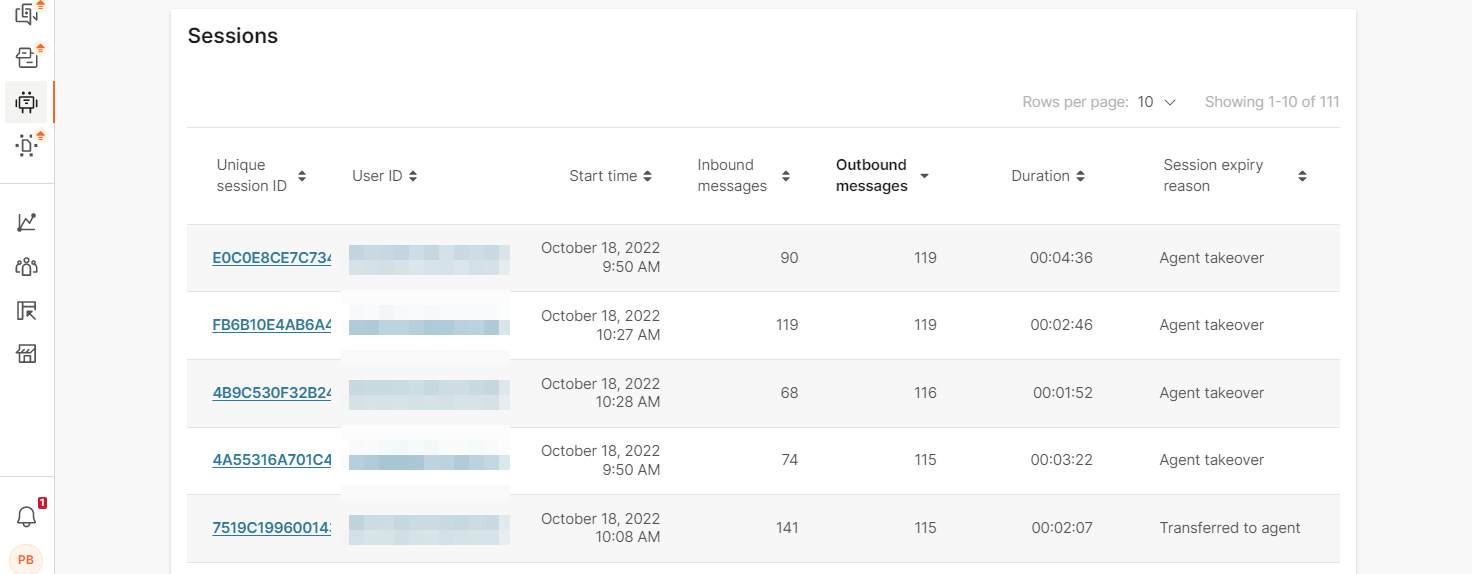
Sessions drilldown can give you a better picture on how each of the user sessions looks like. Sort the table by any column that you want to learn more about and check what is the usual number of inbound messages by users, how long do the conversations last depending on the number of exchanged messages, etc.
Select how many items you want to see on the page by changing the value of Rows per page(10, 25, 50, 100).
The API call widget will display the URL endpoints, if there were any executed in the session(s).
The API calls are displayed here only when a single chatbot is selected.
Depending on the configuration of API calls in the chatbot itself, the endpoint URLs will display either the originalUrl (without resolved attributes in the URL) or resolvedUrl (with resolved attribute in the URL).
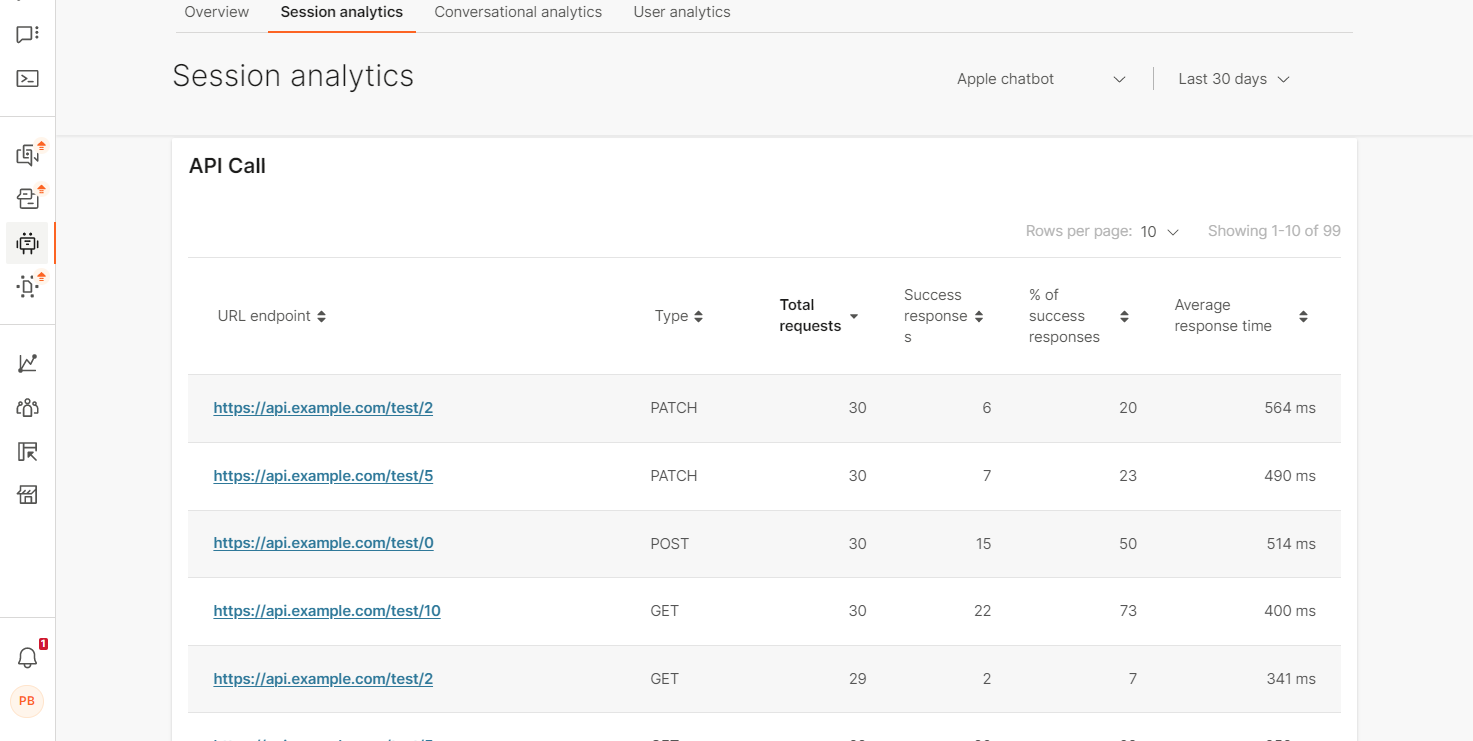
For more information on the API calls themselves, click on any of the URL endpoints.
For each URL endpoint you can see how many times it was called, and check the following:
- Response codes – all available responses a request can have
- Count – how many times the response code was triggered. Useful to see if any of the calls are not successful (and what type of response codes they trigger)
- Average duration – in milliseconds
If you selected a URL endpoint that didn’t display its resolved URLs in the Session analytics, once you click on it, you will be able to see all the resolved URLs for that endpoint.
For each Resolved URL, you can check the following information:
- Response code – helps see which http requests are not successfully completed
- Response duration – how long it took for the request to complete in milliseconds
- Timestamp – the exact execution time
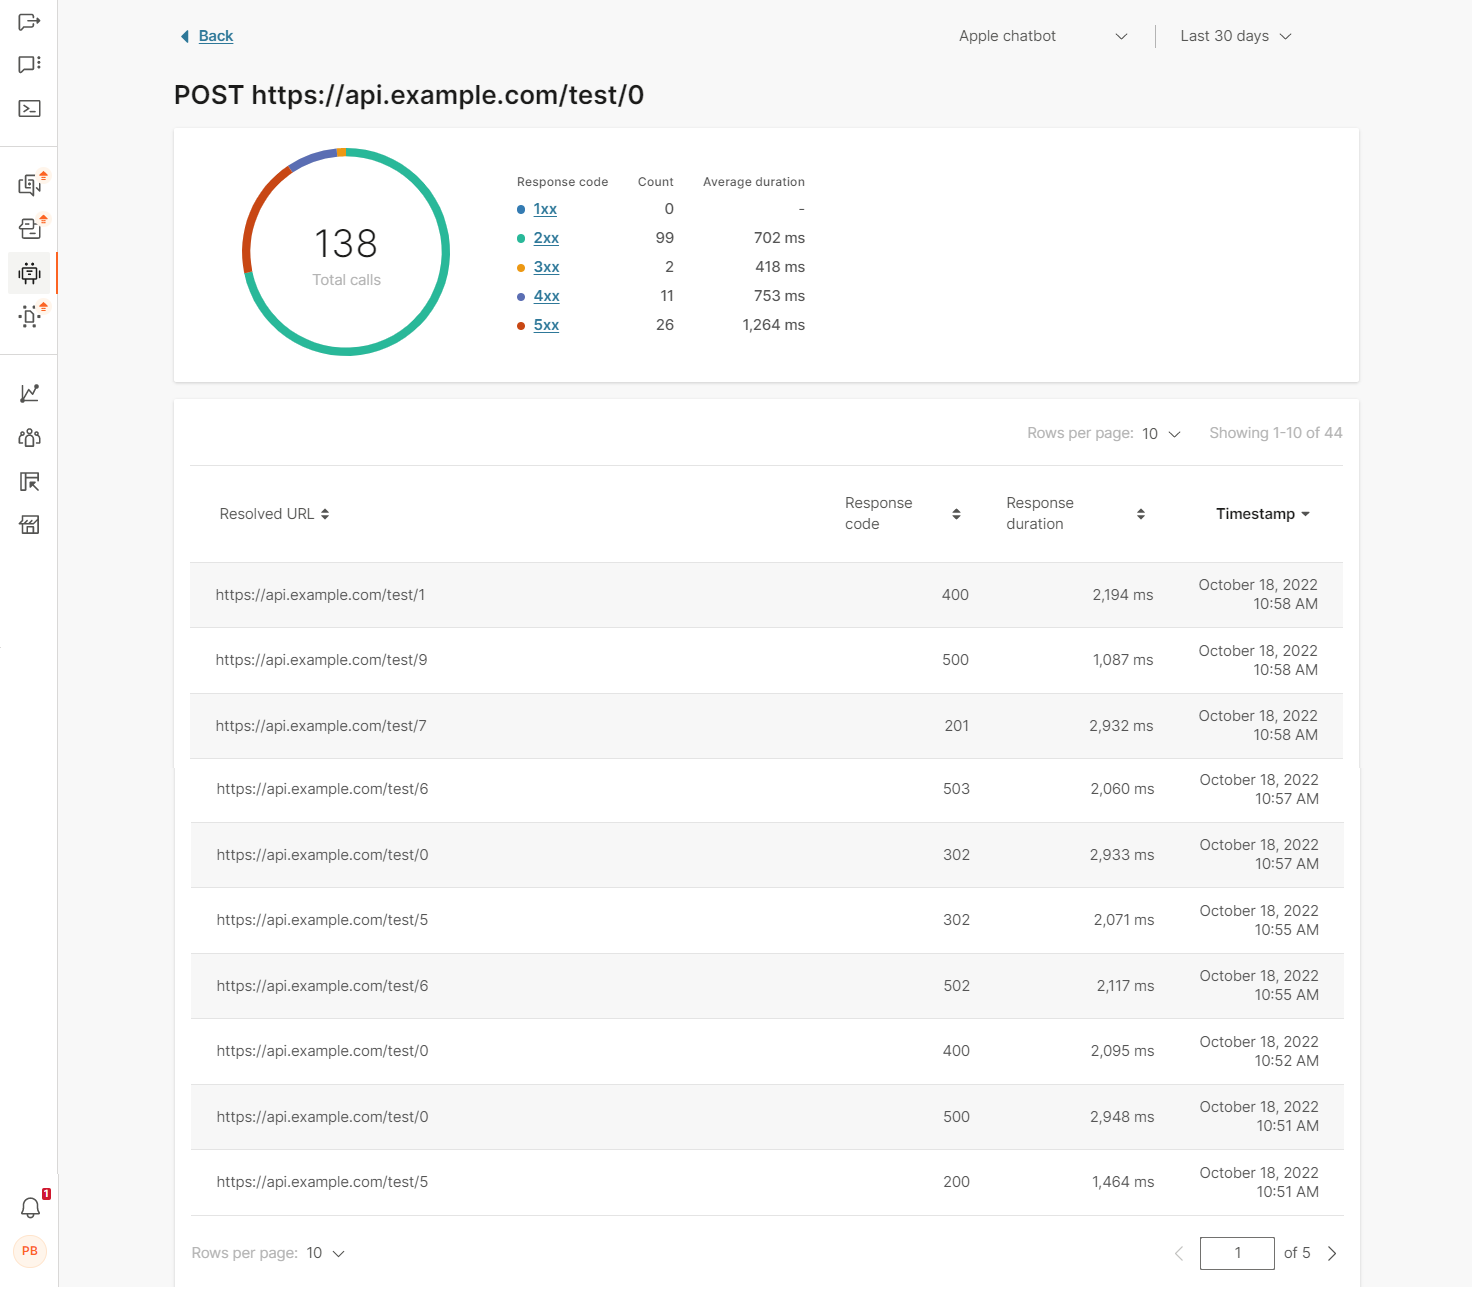
Use Back to return to the main Analytics window.
Conversational analytics
Conversational analytics lets you see:
- Total number of messagescompared with messages that are only part of Engaged sessions
Hopefully, the difference between the two is not large because that would mean that the messages the chatbot sends as the initial response do not engage users
- Average number of messages in all sessions vs. average number of messages in Engaged sessions
See how many messages are generally exchanged and compare with the designed scenarios to see if the numbers correlate
- Total/ average messages timeline graph
Follow the frequency of exchanged messages through the selected period of time
- Breakdown of conversations by Dialogs and Intents
Which dialogs get triggered most often and how often are they the starting dialog (or ending) and which intents the messages trigger the most often and in how many sessions did that occur
- Breakdown of Unrecognized intent messages and Unhandled messages
Keep a close look on this widget because it will show you where your chatbot fails in conversations (cannot resolve the end user messages into correct intents or process them correctly). You can add these messages to an existing intent or, if the intent doesn’t exist, implement a new intent to deal with the unrecognized items.
- Breakdown of User start messages
Gives insight into how your end users like to start the conversations. Beware that the messages in this table do not appear on the list of unrecognized intents or unhandled messages
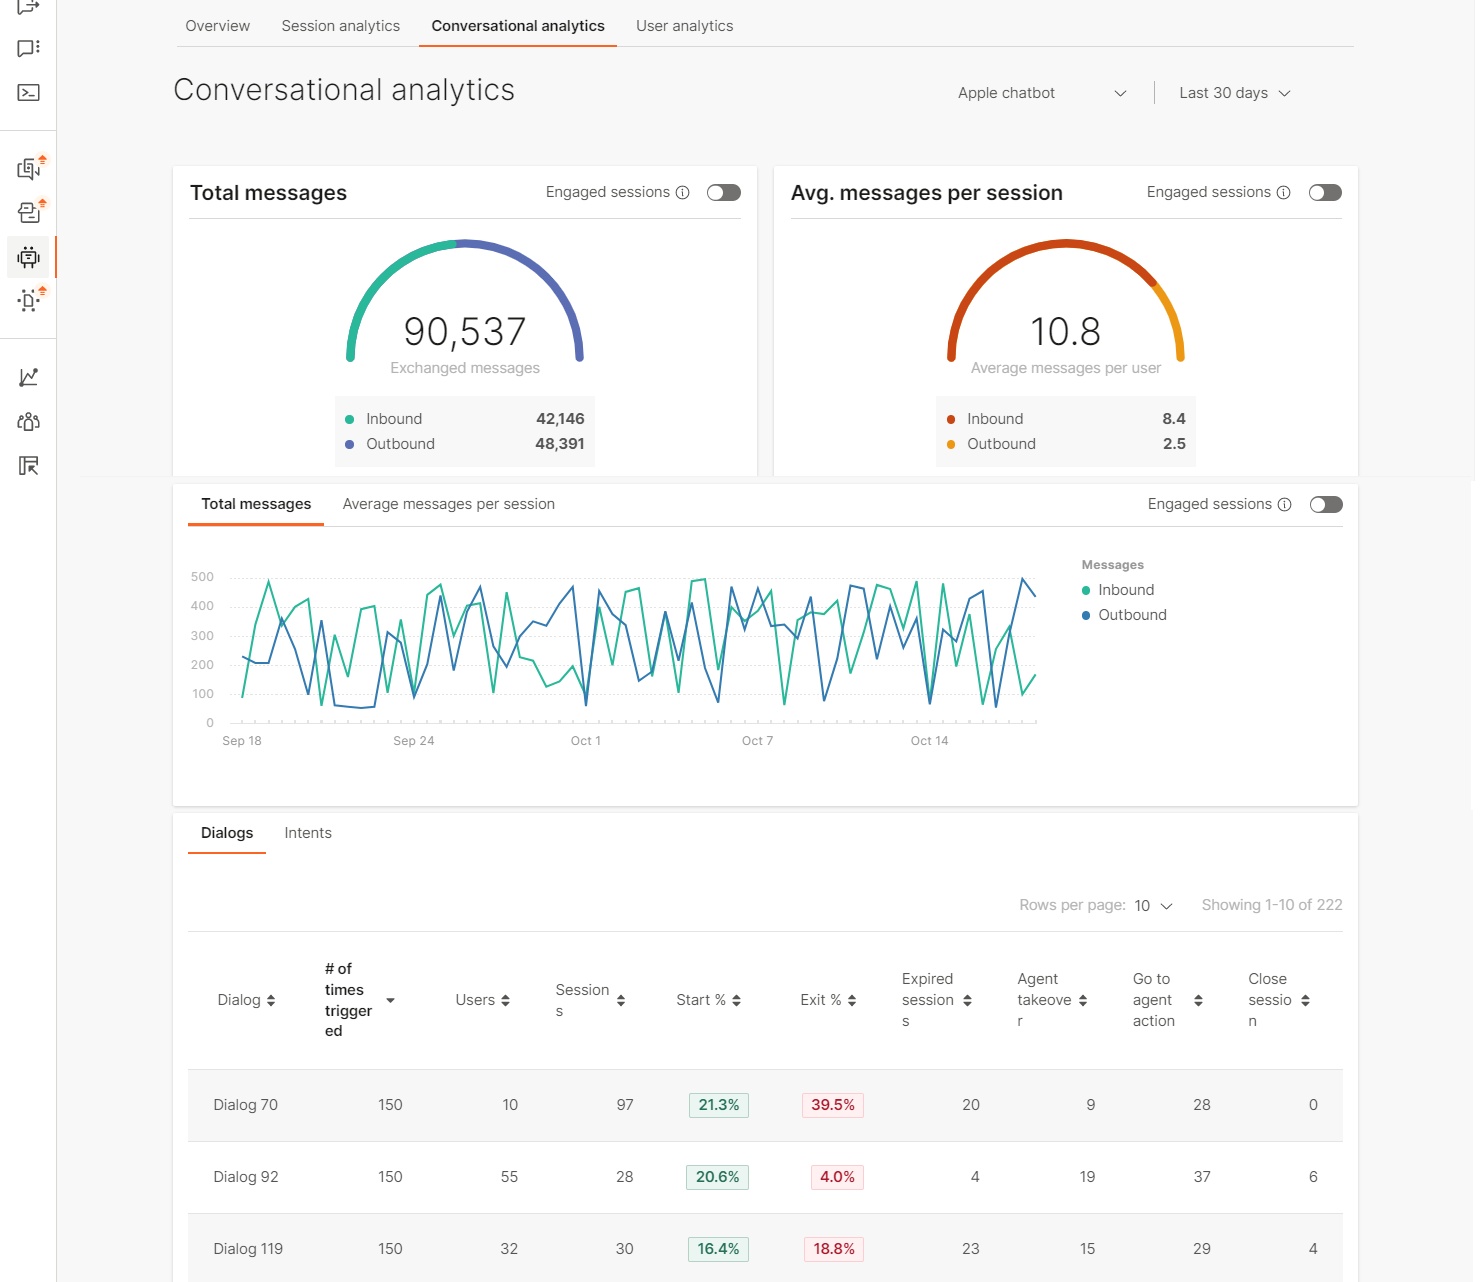
Whatever you select for viewing (all chatbots or a single chatbot), the circular graph will illustrate the difference between how many were Inbound(sent by the end user) and how many Outbound (sent by the chatbot) in different colors.
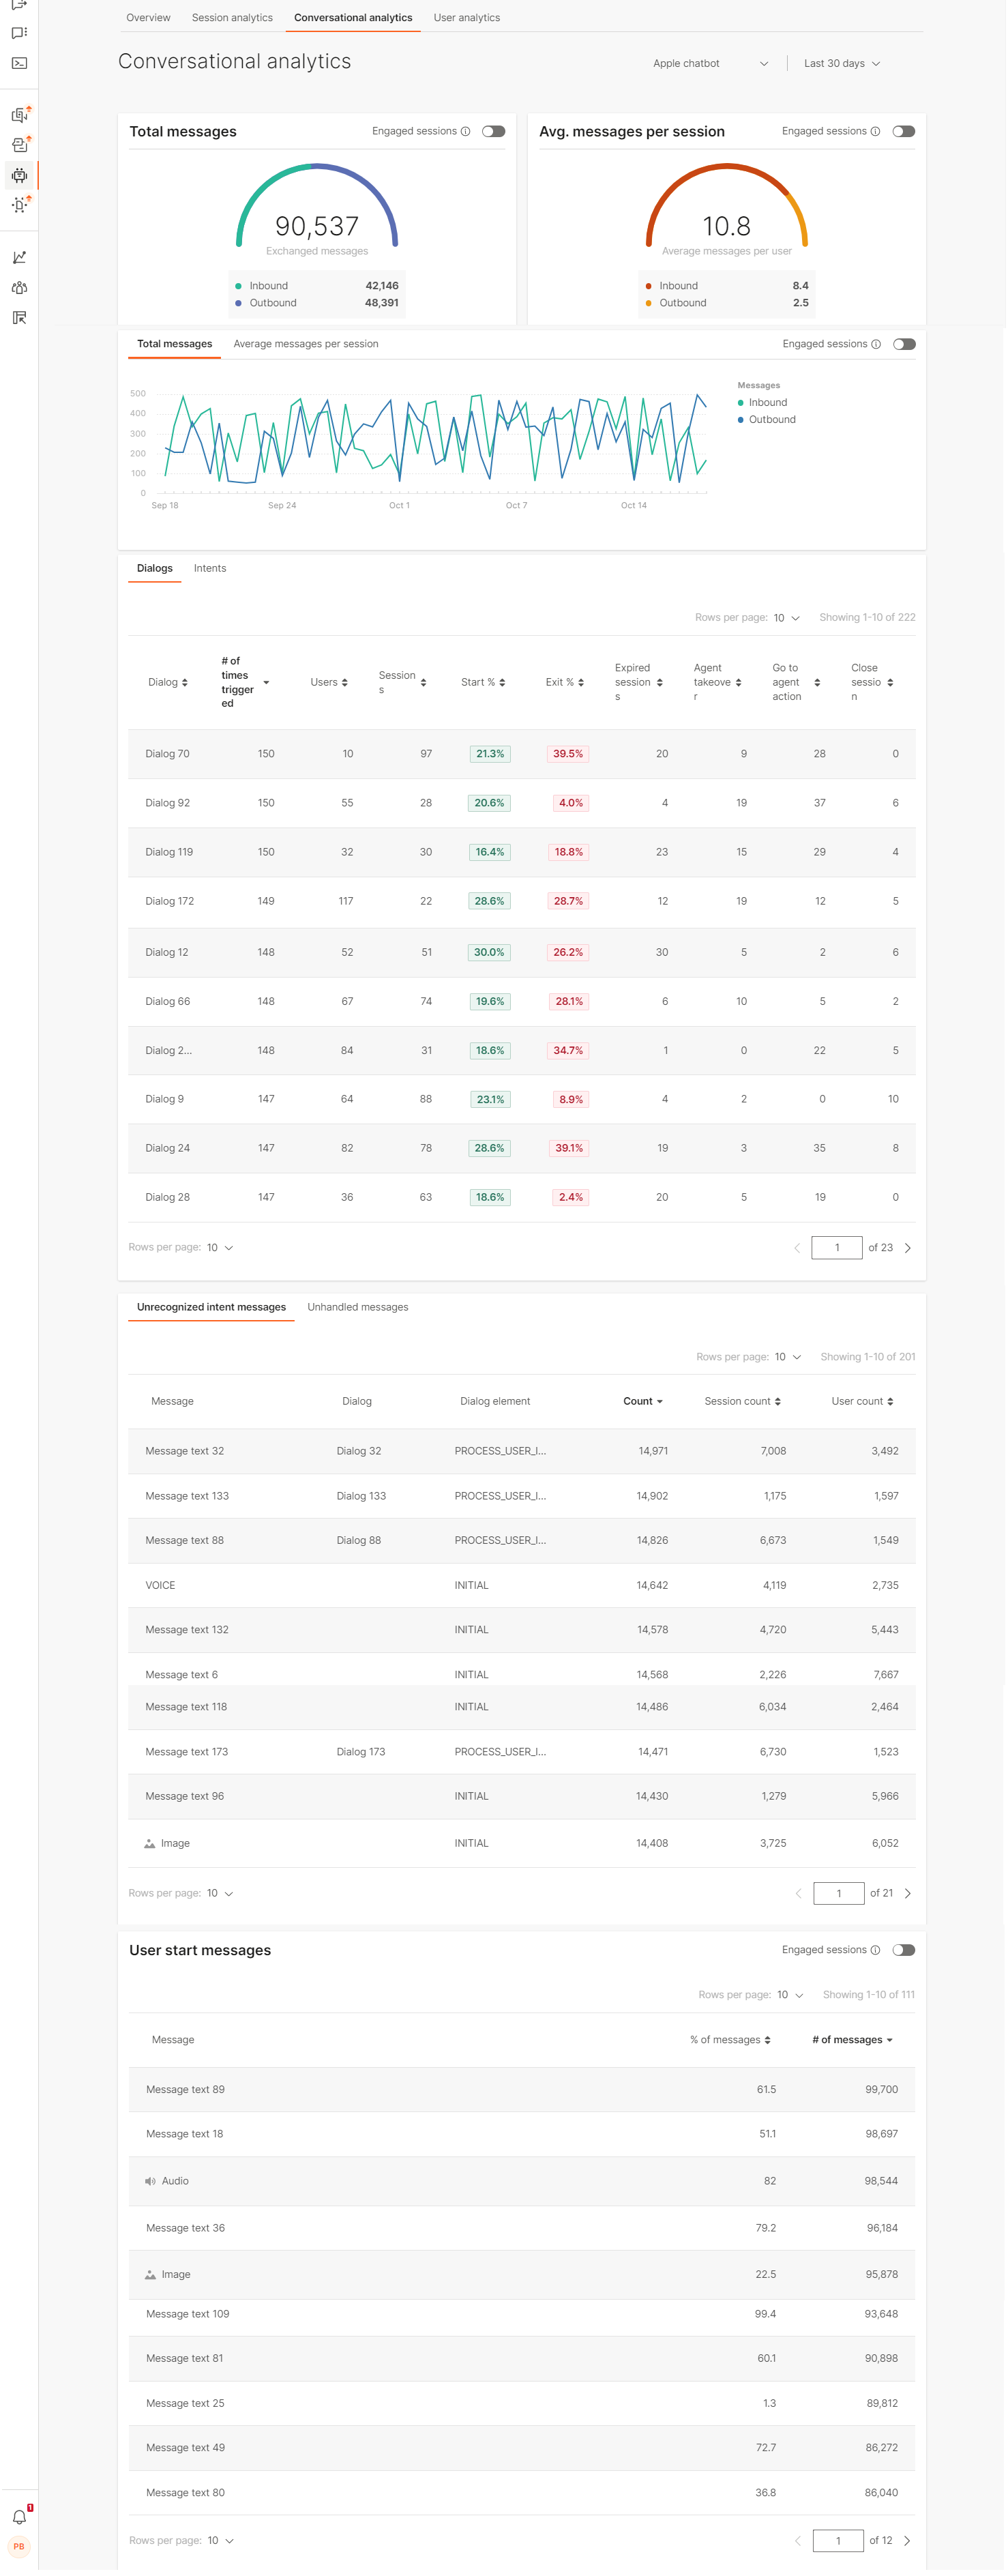
You can see the total number of messages exchanged and how it correlated to sessions and was the session average.
This is followed by the timeline graph widget displaying the messages over a period of time, separated into two tabs:
- Total messages (Inbound and Outbound)
- Average messages per session (again Inbound and Outbound)
Conversational analytics also includes analysis of dialogs and intents in the selected chatbot.
This is only visible when a single chatbot is selected for analytics.
This information is displayed in two tabs, specifics per:
- Dialogs, and
- Intents
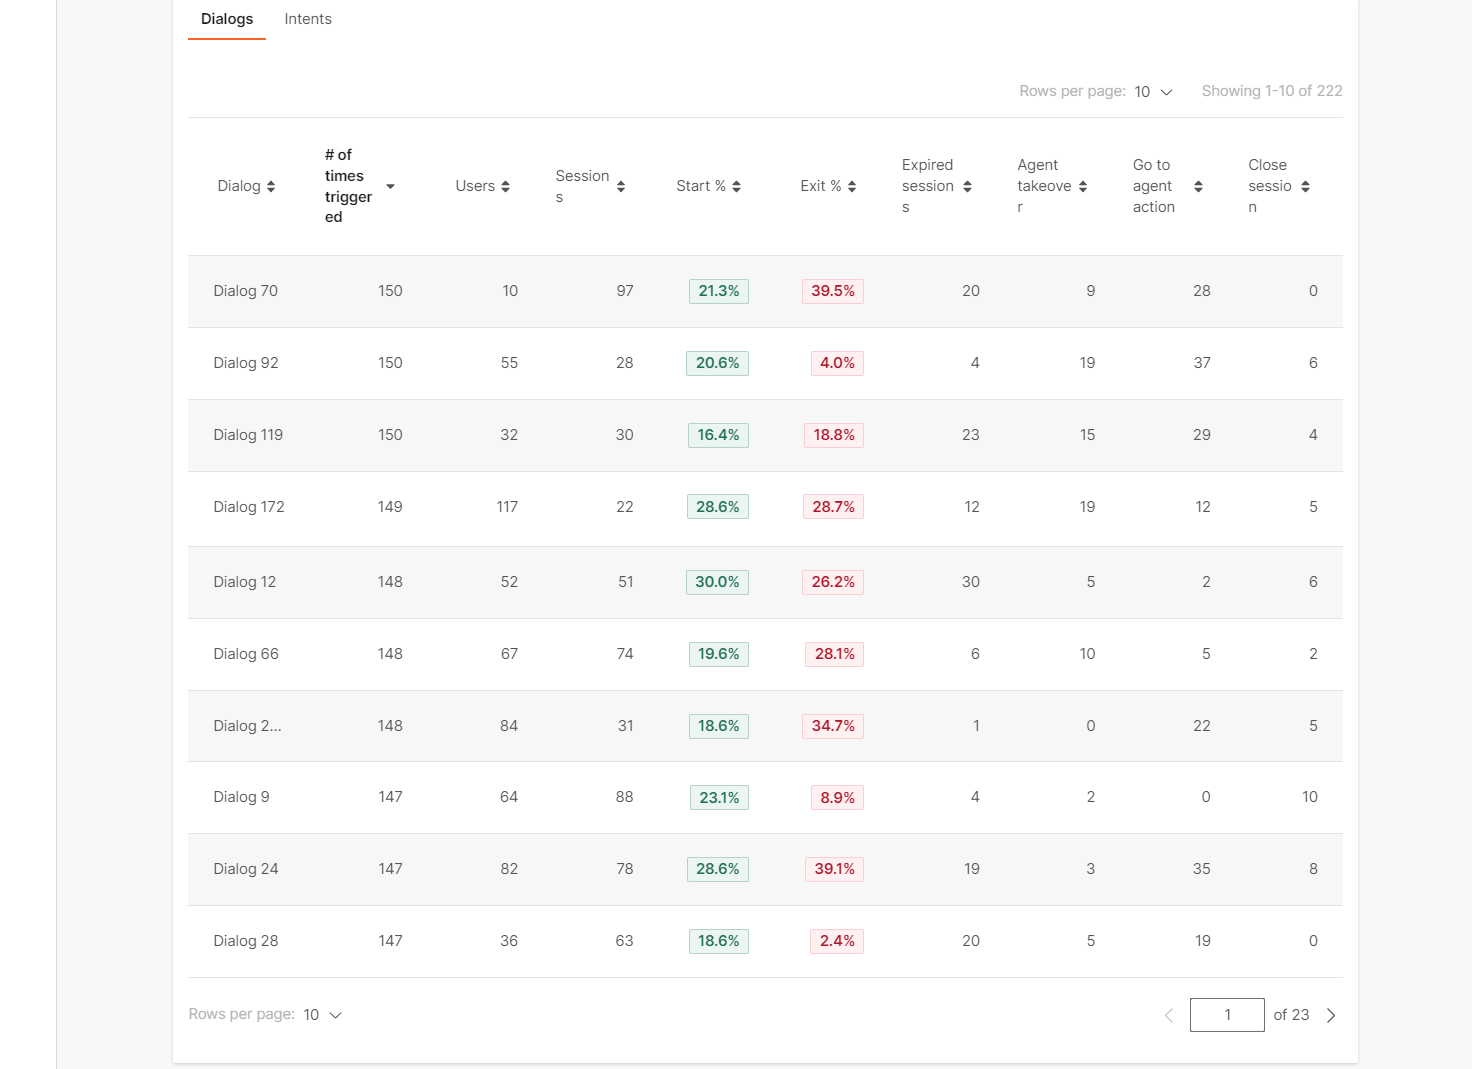
The Dialogs tab gives you an overview how different dialogs in the chatbot perform, how many people land into them, which is the first dialog where the end users land, which of the dialogs ends up confusing users (they require agent help, etc.). The information is split into these categories:
- Dialog name
- # of times triggered – how many times the end users entered it
- Users – the number of distinct users who entered this dialog
- Sessions – in how many distinct sessions it was triggered
- Start % - percentage of how often this is first dialog the users land in when starting the conversation with the chatbot
- Exit %- percentage of how many times this was the last dialog the end user was in. Followed by breakdown of possible session expiry reasons
- Expired sessions- user stopped sending messages
- Agent takeover- agent follows the conversation and takes it over because the chatbot could not solve the user’s problem
- Go to agent action- the end user requested to talk to the agent and was routed to one
- Close session- the conversation ended naturally at the designed point for closing sessions
Bear in mind that the number of sessions, users, and times the dialog was triggered will differ due to the fact that the end user might select to enter this dialog several times while talking with the chatbot.
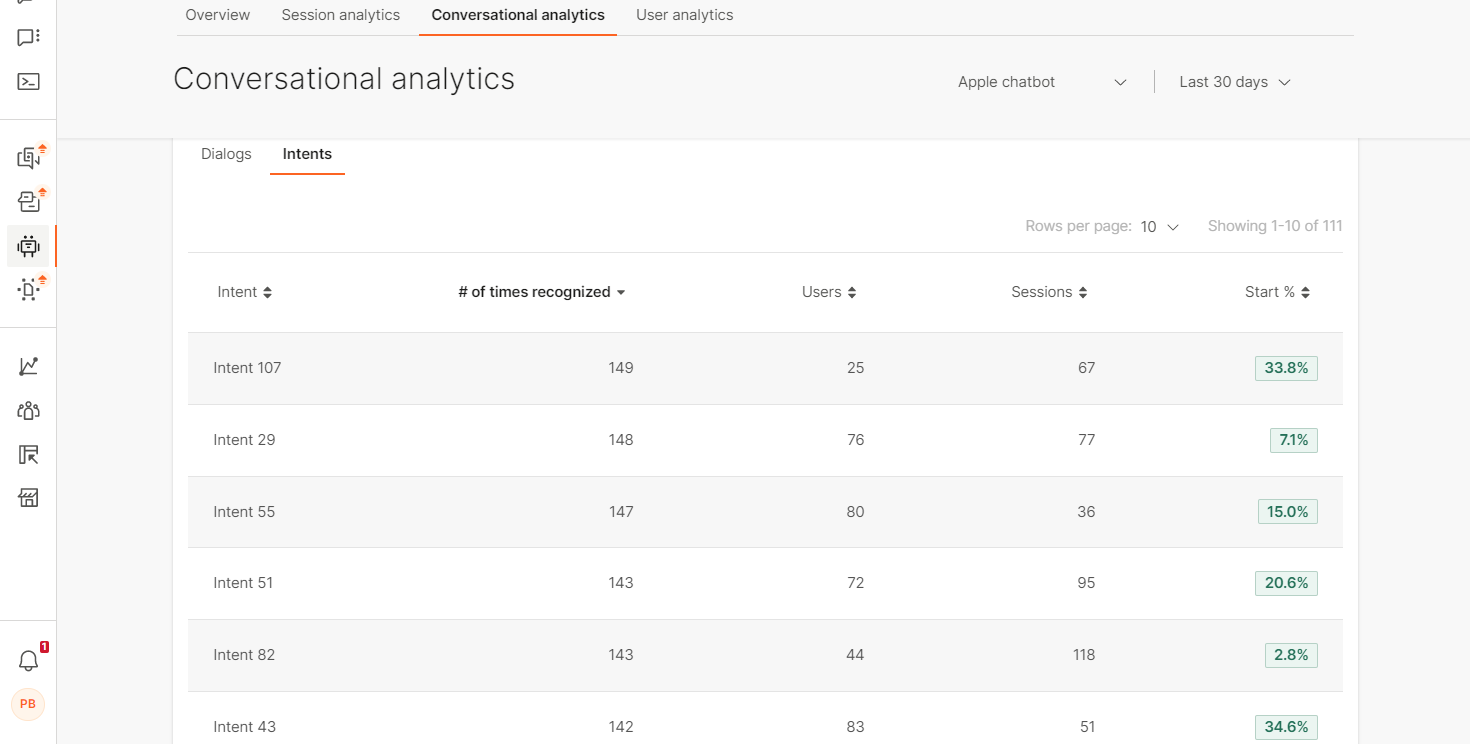
When it comes to intents, for each of the intents in the chatbot you can check the following:
- Intent name
- # of times recognized – the chatbot recognized the end users’ utterance and forwarded the user to the correct intent
- Users – number of distinct users
- Sessions – number of sessions in which the intent was recognized
- Start – how many times it was the first recognized intent
The intents widget informs you what are the most recognized intents which correlate to dialogs based on these intents. You can compare the number of times an intent is recognized with the number of times the dialog based on that intent is triggered and see if there is a difference. A difference would mean that there are other ways to enter that dialog, not just through the intent it is based on.
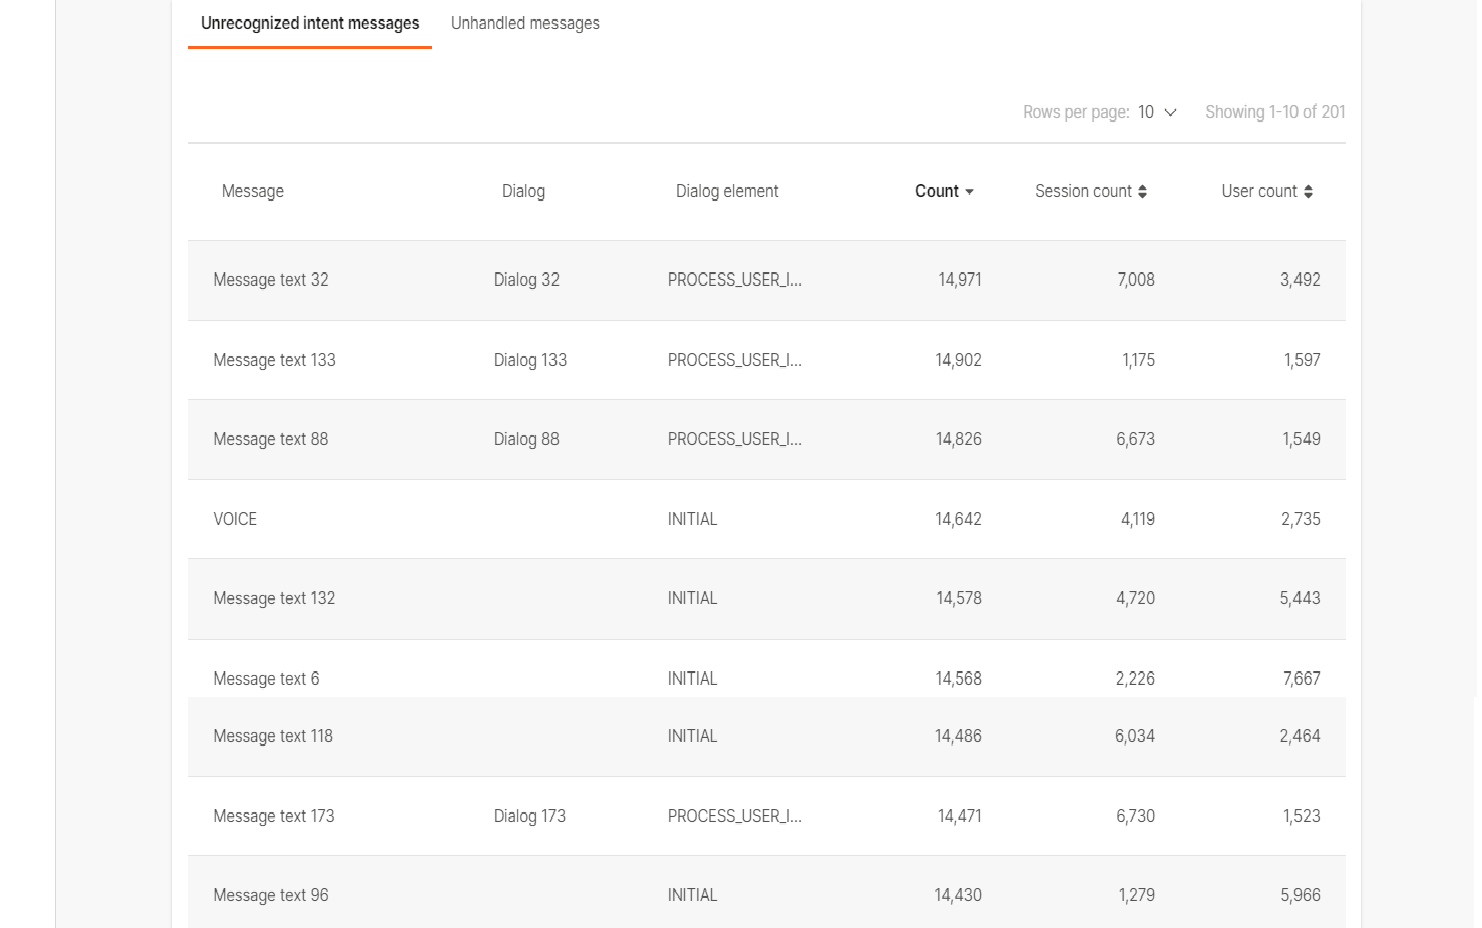
Once you check the recurrence of dialogs and intents, you can continue to analyze the behavior of your chatbot by checking the unrecognized intent messages and unhandled messages.
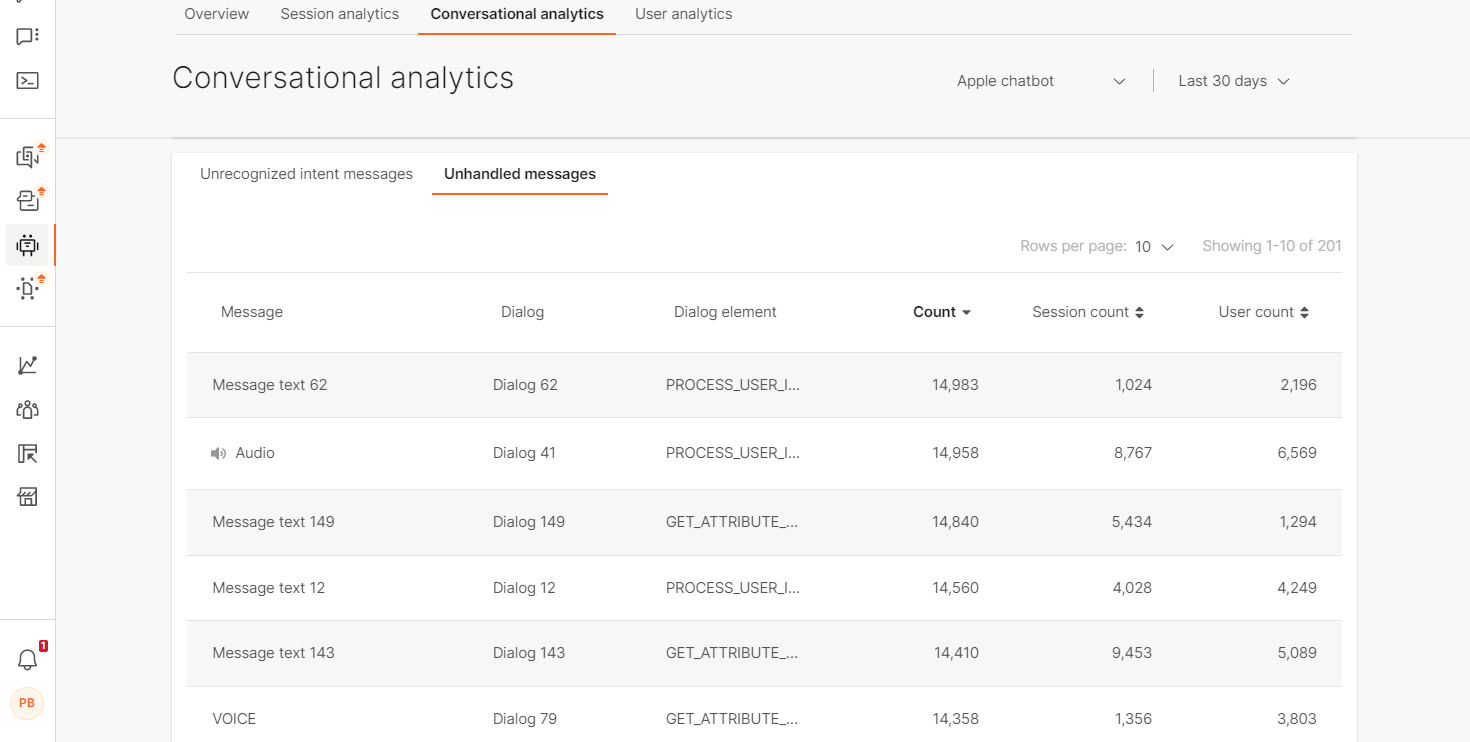
This widget will display all unrecognized intent messages your end users sent which the chatbot didn’t recognize. The chatbot could not assign them any of the intents in your bot. The second tab displays the unhandled messages, i.e. messages that the end users sent but that did not correspond to what the chatbot expected as the response.
This information is useful for additional training of your chatbot because it gives you insight into what kind of messages your end users send and where there are gaps between them and the intents.
- Message – the unrecognized user input
- Dialog – name of the dialog where it happened (if it didn’t happen inside a dialog, this will be empty)
- Dialog element – if it happened inside a dialog, this is the dialog where it happened
- Count – how many times this particular message was received
- Session count – how many sessions this happened in
- User count – the distinct number of users who sent the message
The list of messages you get from this table and their recurrence are a useful tool to use to train the chatbotto perform even better (recognize such messages in the future).
Unhandled messages on the other hand help discover where you possibly didn’t include certain messages as options that the chatbot can expect. For example, the user replies with ‘Nope’ when you expected the answer to come as ‘No’.
For all such messages, you can see:
- Message – content of the message
- Dialog – name of the dialog where it happened
- Dialog Element – which element didn’t recognize the incoming message (either User response or Save user response)
- Count – how many times this particular message was received
- Session count – how many sessions this happened in
- User count – the distinct number of users who sent the message
When you regularly check these messages, they can help identify if you missed some scenarios when designing your chatbot (many users send messages that the bot doesn’t expect or cannot handle).
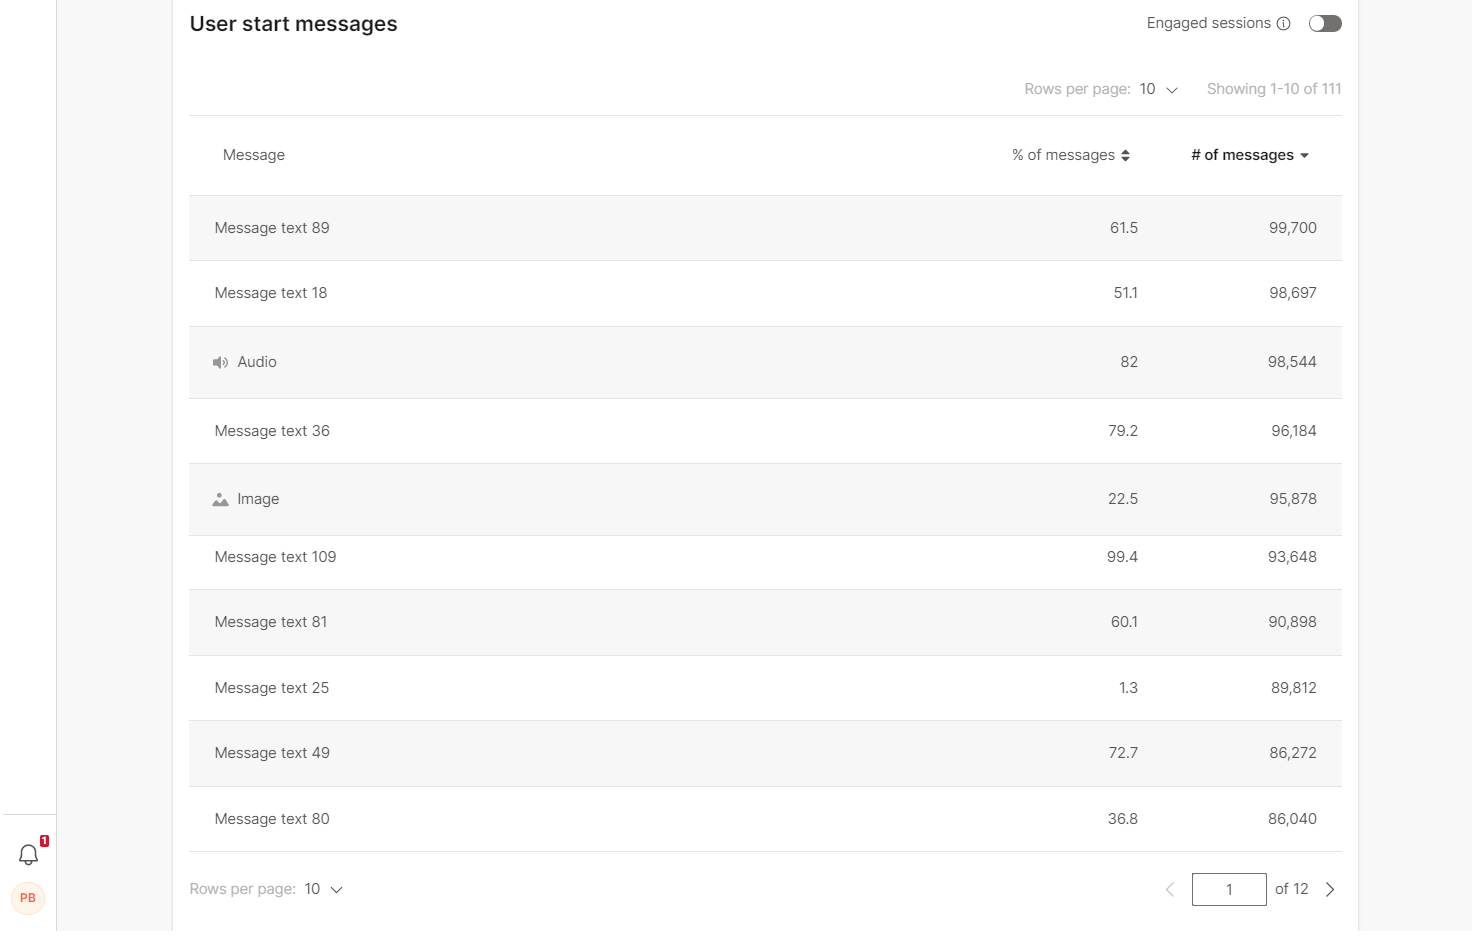
The last conversational widget is the one that shows how your end users begin their conversations with the chatbot.
User start messages are sorted by the occurrence and the most common message will be the first on the list. For each of the messages here, you can see the:
- % of messages – the percentage of this starting message for all your chatbot communication
- # of messages – how many messages the percentage translates into
This widget can help identify what personas most commonly chat with your bot. Examine the incoming messages to find out what type of people usually talk with your chatbot.
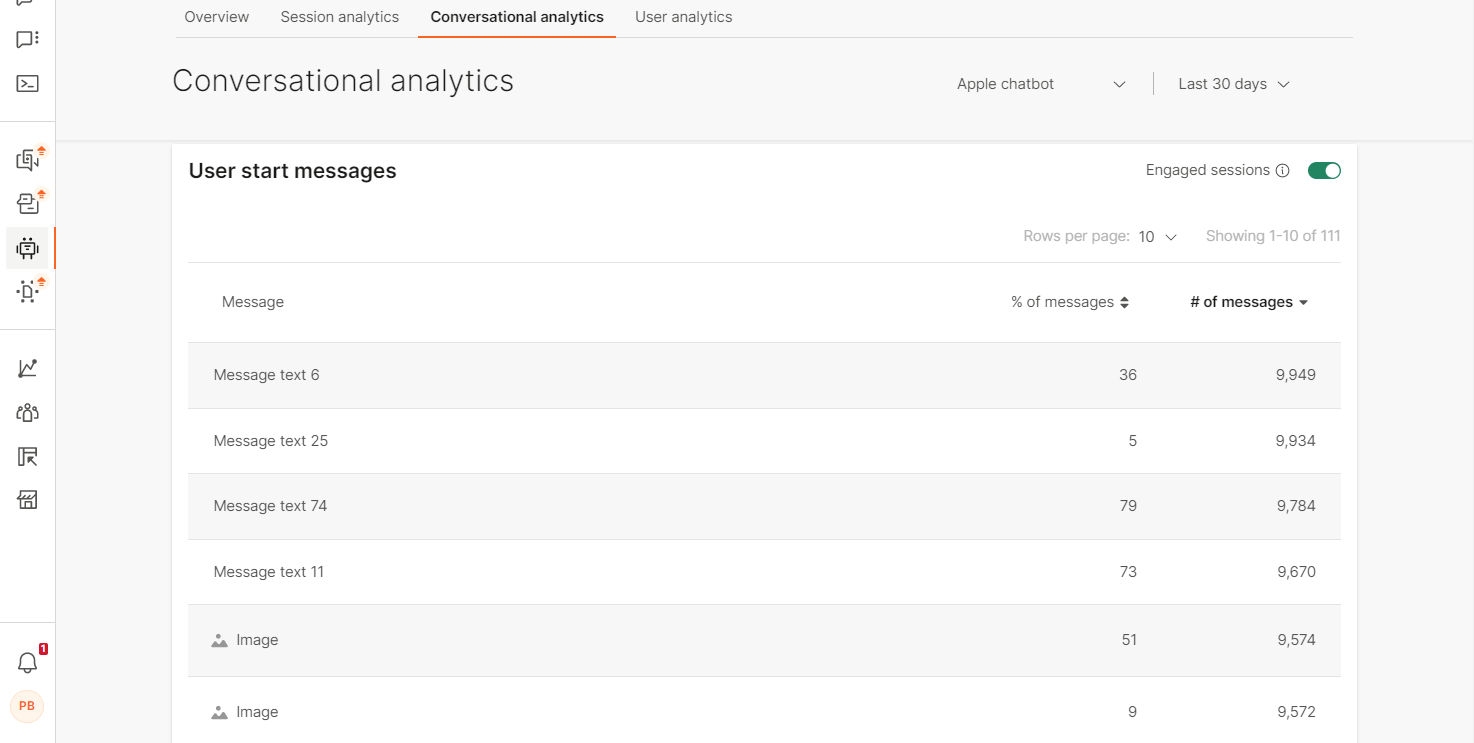
Beware that the start messages don’t appear in the unrecognized intents and unhandled messages section. To learn more on how to make your chatbot smarter, go to the How to section.
User analytics
User analytics section delves deeper into the behavior of end users. It is split into the following sections:
- User summary
Quick overview of total, new and returning and how many of them are engaged users
- User summary timeline graph
Follow the rise and fall of total, new and returning users through a certain period
- User details
Get more insight into how each user chats with the bot
- CSAT breakdown by response/response volume
See how willing your end users are to complete surveys and how happy or unhappy they are with the whole experience of chatting with the bot
- Surveys
Learn what the end users think of your chatbot, not only how happy or unhappy they are with the whole experience, but what their opinion is by the comments they leave
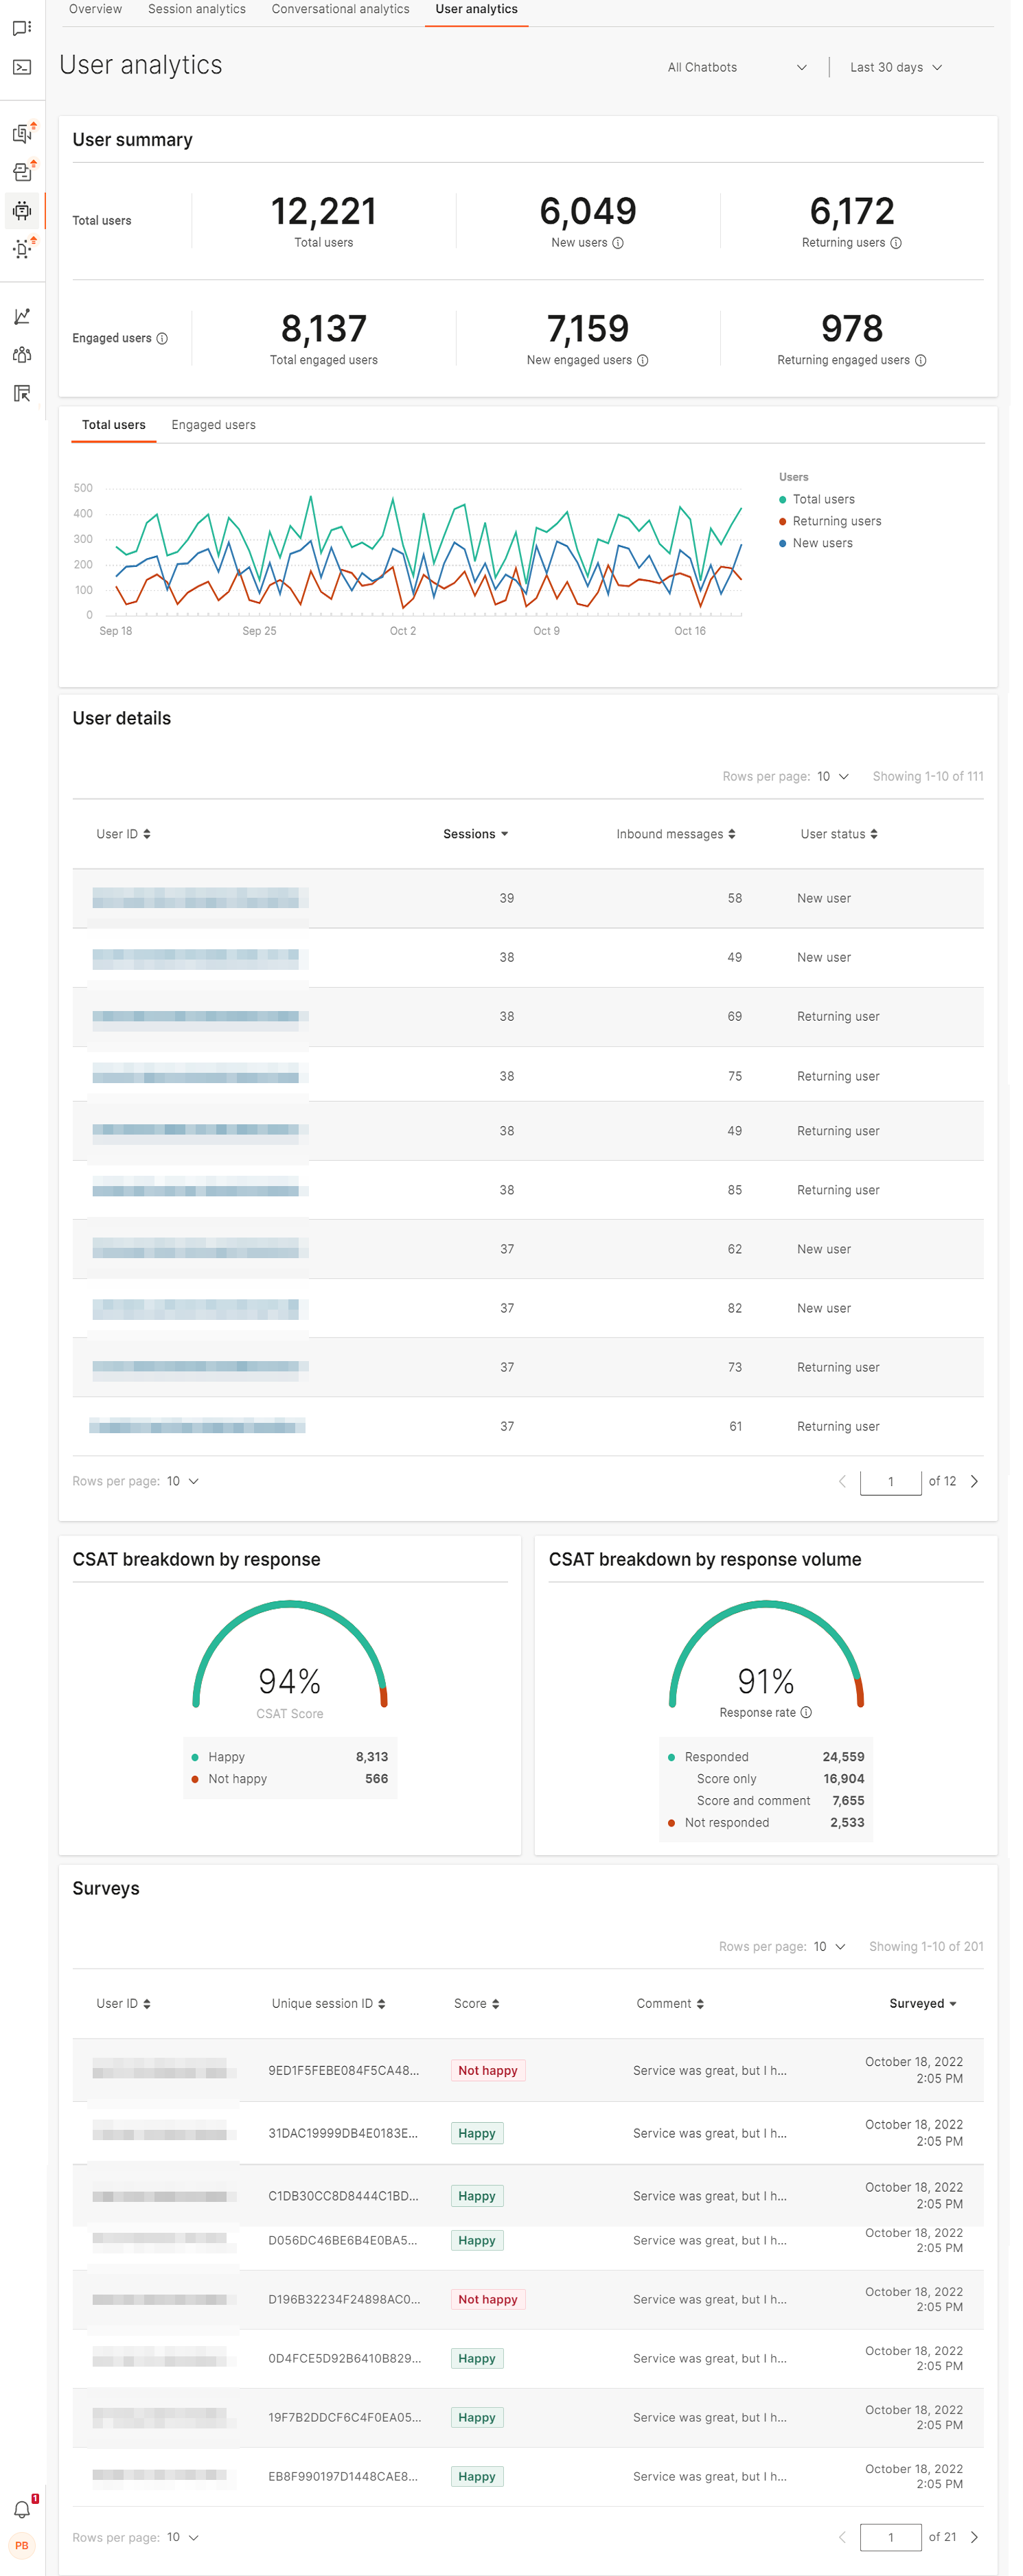
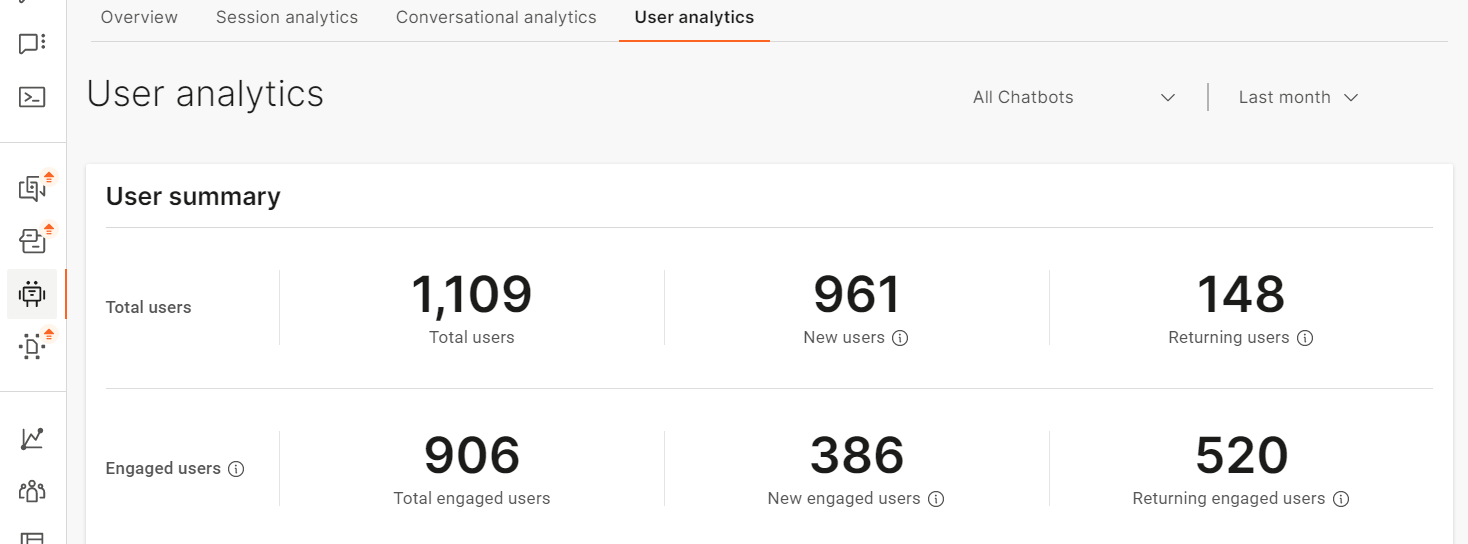
Use the User summary section to get an overview of the number of end users who interacted with the chatbot, specifically how many of these end users engaged in the conversation with the chatbot (initiated a chat and then sent a minimum of 1 message to the chatbot.)
For each of those users, you can see how many of them interacted with the chatbot for the first time or if they had previously talked to the bot and then returned for another chat.
In the User summary timeline graph you can follow the interaction between your end users and the chatbot. Check what are the peak times and whether your users return to the conversation (especially as engaged users) as the graph shows lines for:
- Total users
- Returning users
- New users
You can position the mouse anywhere on the graph line to check the specific information at that point in time.
Underneath the timeline graph, you will be able to check some user details like:
- User ID – depends on the channel where the chatbot is deployed. Example: phone number
- Sessions – total number of sessions the user had with the chatbot
- Inbound messages – how many messages the end user sent
- User status - whether this is the first time the user is interacting with the bot or has previously already chatted with the bot
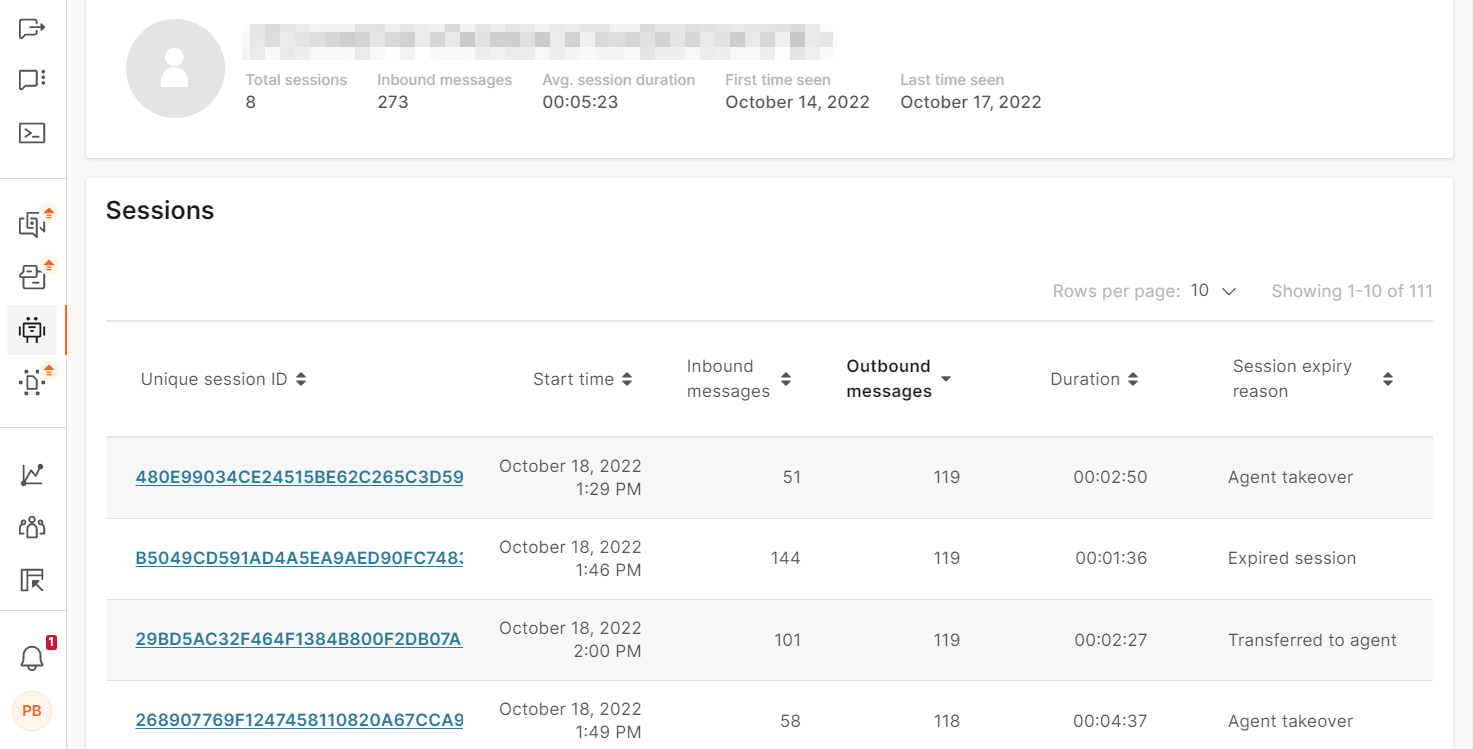
If you want to know about the particular user, click on their User Id to see the user drilldown. This will open the analytics view of that user with details regarding the sessions at the top of the page:
- Total sessions – number of sessions the user started
- Inbound messages – the total number of messages this user sent to the bot
- Average session duration - what was the average time the conversation lasted
- First time seen – the initial time of the first message the user sent
- Last time seen – the last time the user chatted with the bot, time of the user’s last message
To learn more about the end user behavior in the chatbot sessions, you can check the particulars of each session:
- Unique session ID – unique ID for the session. Format: UUID4. Example: bbd86e7a-47a6-4fba-8d67-1c8cfeb62b22. The ID is independent of the end user. Example: if an end user initiates two chat sessions with a bot, two unique IDs are generated, one for each session.
- Start time
- Number of Inbound messages
- Number of Outbound messages
- Duration
- Session expiry reason
This information lets you learn how long do the conversations last, how do they end (expired sessions are good but requests for agent’s help might not be) and what is the usual time when the user chats with the bot.
You can compare different user analytics to learn more about the behavior of your end users.
To view a conversation, click its Unique session ID.
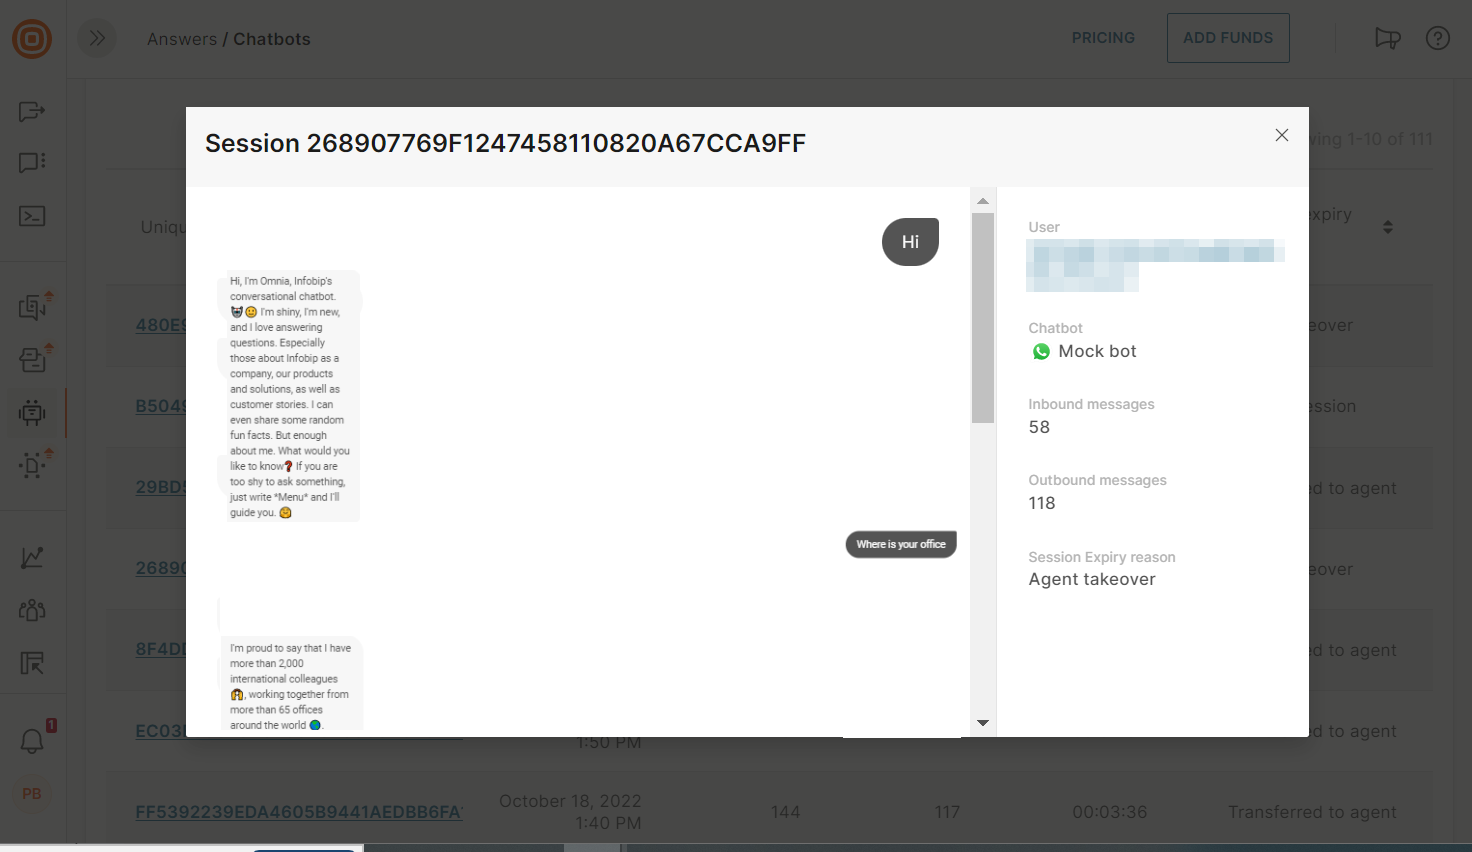
You can scroll through all the messages exchanged between the chatbot and the user and check the overview of the conversation on the right side.
Close the window on the X button in the upper right corner and click Back to return to the User analytics tab.
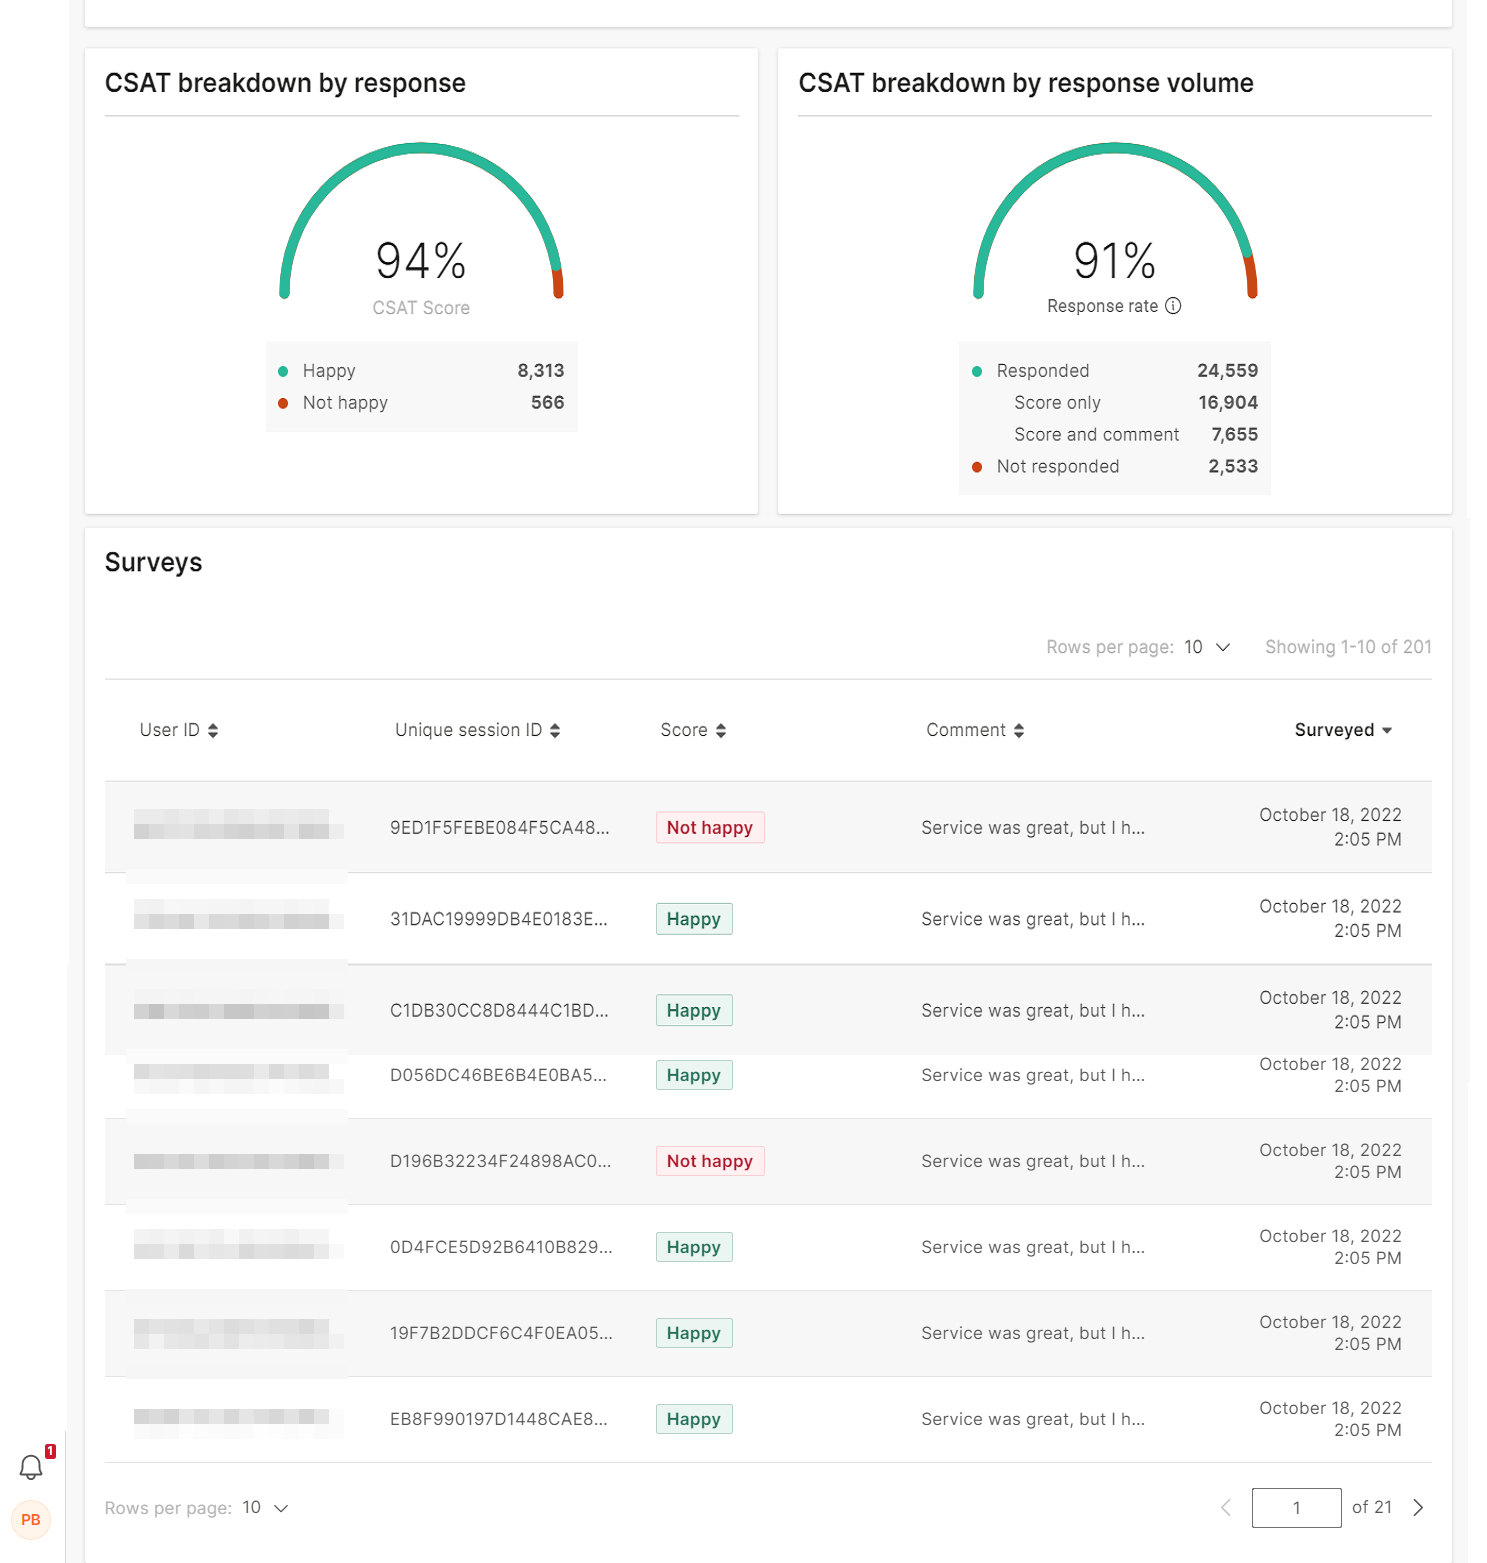
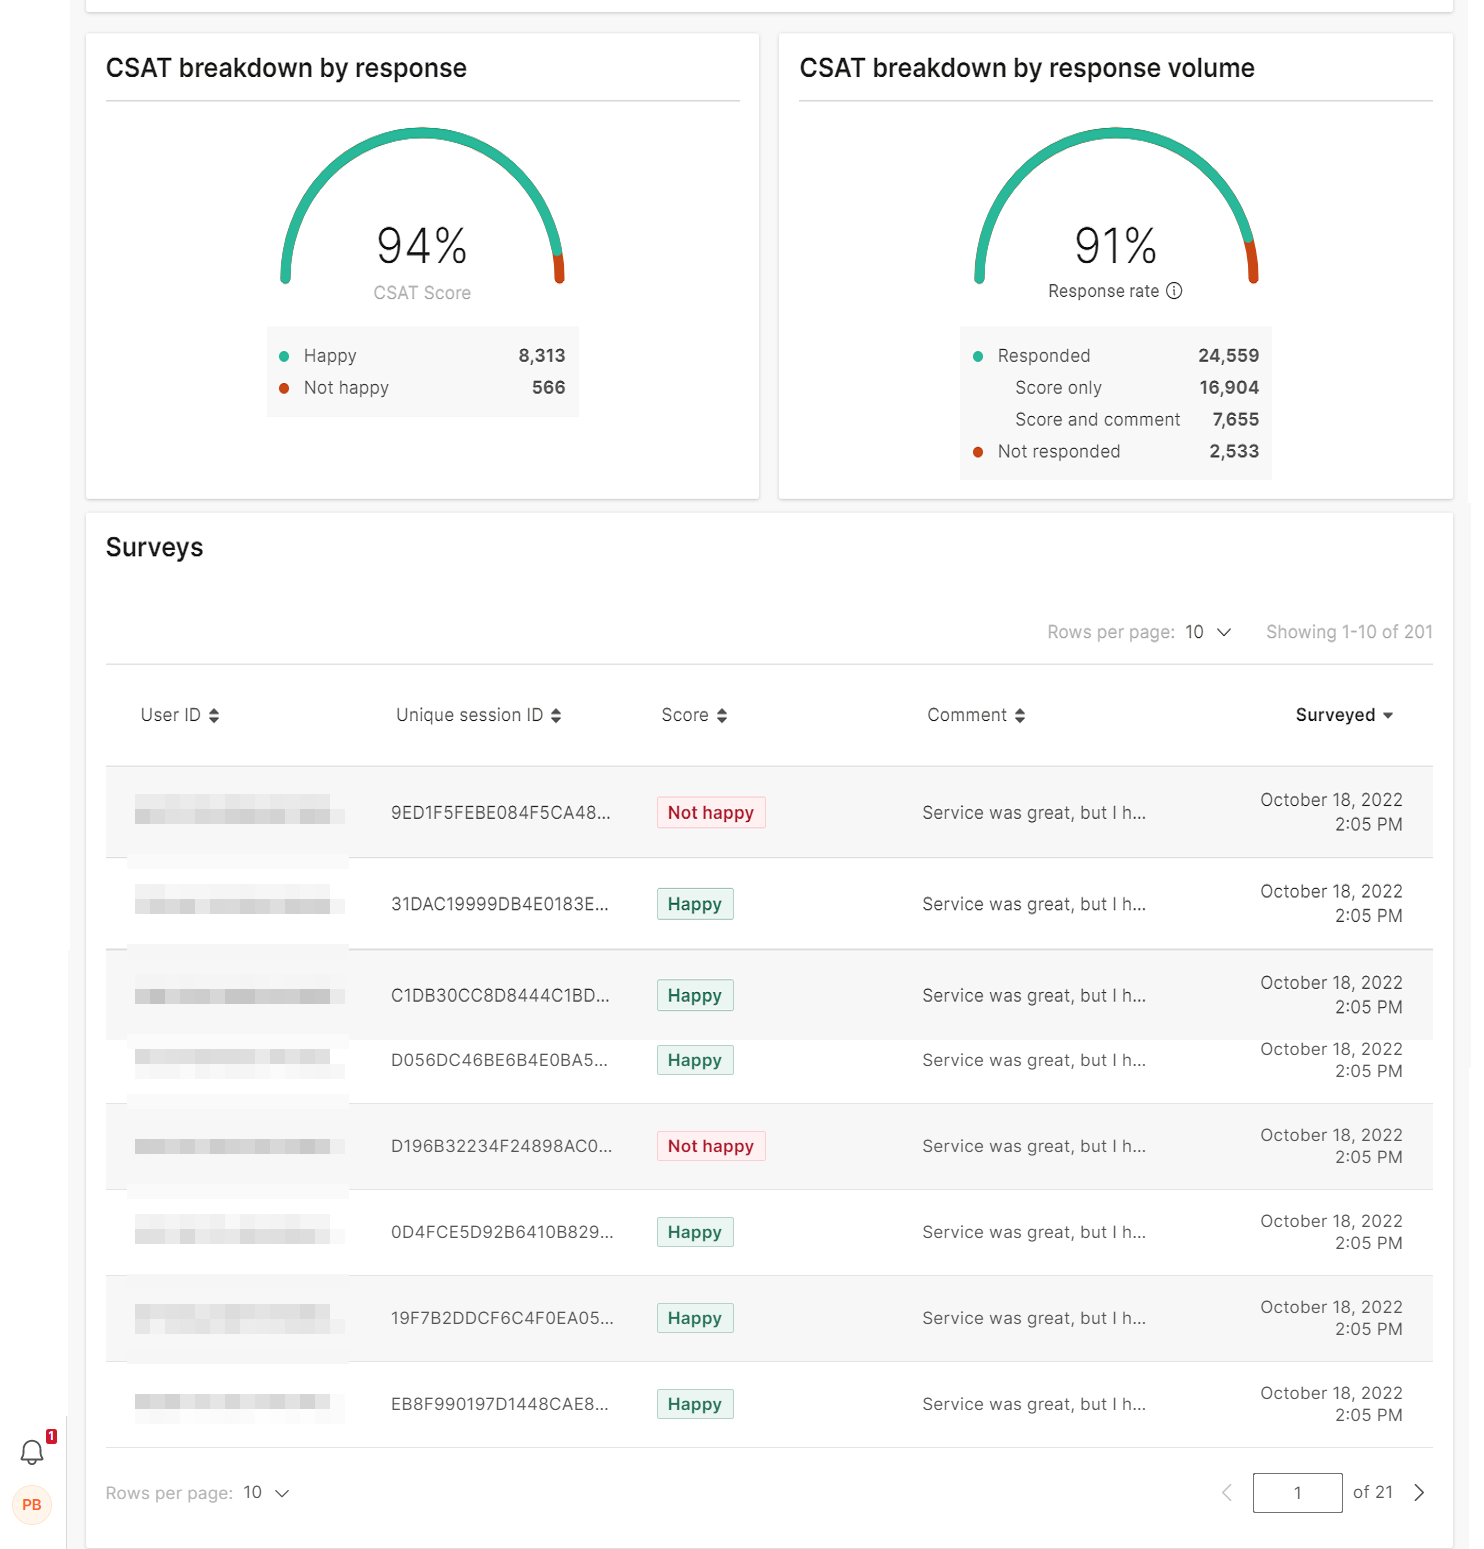
User analytics also display the CSAT statistics (to have values here, you need to have CSAT element configured in your chatbot).
The CSAT widgets will show you:
- User response – either Happy orNot happy
- Breakdown of responses – how many users responded (with or without comment) and how many did not respond
The CSAT widgets are followed by Surveys information where you will find the specifics of each CSAT response:
- User ID – depends on the channel where the chatbot is deployed. Example: phone number
- Unique session ID – unique ID for the session. Format: UUID4. Example: bbd86e7a-47a6-4fba-8d67-1c8cfeb62b22. The ID is independent of the end user. Example: if an end user initiates two chat sessions with a bot, two unique IDs are generated, one for each session.
- Score – Happy or Not happy
- Comment – if the user left a comment with their CSAT score, it will be shown here
- Surveyed – date and time of the user response
Use this information to improve your chatbot design. You want your users to end the conversations happy and if you start getting many Not happy responses, check the comments accompanying them to see where the users get stuck and what are the most common issues they face when interacting with the chatbot.
You can sort the information by ordering columns to ascend or descend (using the arrows beside them).
The number of total sessions you see here may in some cases vary (there might be small differences in %) from other Infobip services, due to a separate processing system and logic.
Quickly identify if your chatbot performs well
Deploying a new chatbot is a feat, and of course, you want to know if what you designed performs according to your assumptions. Here is where you will find a short overview on how to do that and these are the topics which are covered:
- Is there a large discrepancy between total and engaged sessions?
- Do your users return to conversations?
- Use CSAT and get feedback from your end users
- Do many users request agent help or agents need to take over conversations?
Discrepancy between total and engaged sessions [#-discrepancy-between-total-and-engaged-sessions-quickly-identify-if-your-chatbot-performs-well]
This is the first and most visible thing you can check. Go to the Overview tab and the first information you will see is the total number of sessions and users. It is preferable for most of your sessions/users to be engaged because that means that the users continue chatting with the bot after they have sent the initial message to begin the conversation.
For example, if you notice that only half of all started sessions are engaged, this means that your end users lose interest in talking with the chatbot after they receive its reply. Think of ways you can make the initial chatbot message more engaging. Consider whether the users know what’s expected of them, explain initially what the bot can do for them and offer options (or examples) of messages they can send to the bot.
One more thing that can cause discrepancy in sessions is if, instead of a user, there is a bot sending messages on the other side. To check whether this might be the case, go to User analytics and click the suspected User ID which allows you to look into the whole conversation (Session ID is clickable and displays all messages in the conversation).
Also, check whether the users' starting messages are part of your chatbot training, meaning the bot knows how to reply to the user. Because if the chatbot cannot figure out the intent behind the initial message and reply to it properly, that can cause users to drop out of conversations.
How many people return [#-how-many-people-return-quickly-identify-if-your-chatbot-performs-well]
Depending on the type of chatbot you have, you might want end users to either return or not return. In both cases, the information about the number of end users who return to the chatbot can help you determine whether you need to redesign or retrain your chatbot.
Example:
- If you have a chatbot through which end users can purchase your products, you might want your end users to return and have new conversations with your chatbot. In this case, a large number of returning users is good.
- If you have an FAQ chatbot or a chatbot that provides technical support, you might not want your end users to return. In this case, a large number of returning users is not good.
If you want your users to return (you offer a retail bot and returning users show that they like the experience), then the larger the number of returning users, the better the users think of your chatbot and the whole experience.
But, if you want your users to resolve their queries the first time they come into contact with your chatbot, then a big number of returning users is not desirable. You can use User analytics to get into details what are the issues your users face. Check the number of sessions in user analytics and for the users who have several sessions, you can get deeper into their analytics to see what challenges they faced.
Use customer satisfaction score [#use-customer-satisfaction-score-quickly-identify-if-your-chatbot-performs-well]
Use CSAT (Customer Satisfaction) score to see how satisfied your end users are after they finish chatting with the bot.
In order to see information in the CSAT part of analytics, you need to have it configured in your chatbot. If you haven’t already added it as a part of your chatbot experience, check how to do it.
Once you have it configured, you can check how many of your users are not happy. As CSAT enables users to leave comments as well, those might come useful as to what frustrations your users face. Not to be accessed only for gloomy scenarios, CSAT will also help you see what makes your users happy.
Basically, any reply to the customer survey should be seen as positive because it means that the users care enough to respond to your survey (and they want to be helpful).
How many dialogs request agent assistance? [#-how-many-dialogs-request-agent-assistance-quickly-identify-if-your-chatbot-performs-well]
You can look this information up in the Conversational analytics. There are two possible scenarios.
The user can request agent help in cases where the chatbot assistance is no longer enough (you designed the chatbot to behave in that way), or an agent needed to take over the conversation as the chatbot could no longer resolve user’s query.
Check the Dialogs in conversational analytics and see which of the dialogs result in either Go to agent actions or in Agent’s takeover. If you see dialog sessions where the conversational design doesn’t require agents’ assistance show up in those columns, this is a clear sign that they need to be re-designed for better performance.
Use Analytics to Make Your Chatbot Smarter
Learn more how to spot where possible conversations misunderstandings happen and how to fix them. This article will cover the following points:
- How your users start conversations
- Are there messages that cannot be assigned to intents?
- What types of messages the chatbot cannot process?
- Dialog entry
Dialog entry [#dialog-entry-use-analytics-to-make-your-chatbot-smarter]
If you want to continually improve your chatbot, we suggest checking Conversational analytics from time to time. The information available there can help train your bot with new data.
Start by checking what are the most common messages your end users send as conversation entry points in User start messages.
Compare these messages with the messages in the Unrecognized intents and Unhandled messages tabs and check that they do not appear on those lists.
If you find start messages that appear in these two lists, continue reading for the next steps.
Unrecognized intents [#unrecognized-intents-use-analytics-to-make-your-chatbot-smarter]
Use the unrecognized intents message list as the new training ground for your chatbot. Check what are the most common messages arriving that the bot cannot resolve into intents.
If there are user start messages that also appear on this list, this means you need to train your starting intent with more phrases (include those that the users send as conversation starters).
It is also possible you will find messages on this list that you didn’t anticipate as possible intent phrases, or even as possible intents in the conversation. Use such messages for improvement of conversation design, add them to correct intents or create new intents where necessary.
Unhandled messages [#-unhandled-messages-use-analytics-to-make-your-chatbot-smarter]
Once you figure out which intents need improvement, check what user messages the chatbot wasn't able to handle inside dialogs.
This will give you a clear overview of where the users don't know how to properly respond to the chatbot (misunderstand what they need to do). Additionally, this can help you determine whether to add more synonyms to help the chatbot understand variants of end users' replies.
Train the bot [#-train-the-bot-use-analytics-to-make-your-chatbot-smarter]
Once you have analyzed the data for your conversations, use your findings to train the chatbot.
- Add missing phrases to intents
- If necessary, add intents where you realize they are missing (improve conversational design)
- Update keywords with synonyms where required, and
- Update processing of User response to reflect the overlooked values