How-to
Drill into data
After you add an insight to the dashboard, you configure drilling for the insight. You cannot drill into a KPI.
You can drill into the following:
- Insight
- Dashboard
- URL
After you configure the drilling, when you click on a fact, metric, or attribute in the View mode, the target insight, dashboard, or URL opens.
You can configure multiple drilling options for the same insight. Example: You can configure drilling into an insight and a dashboard.
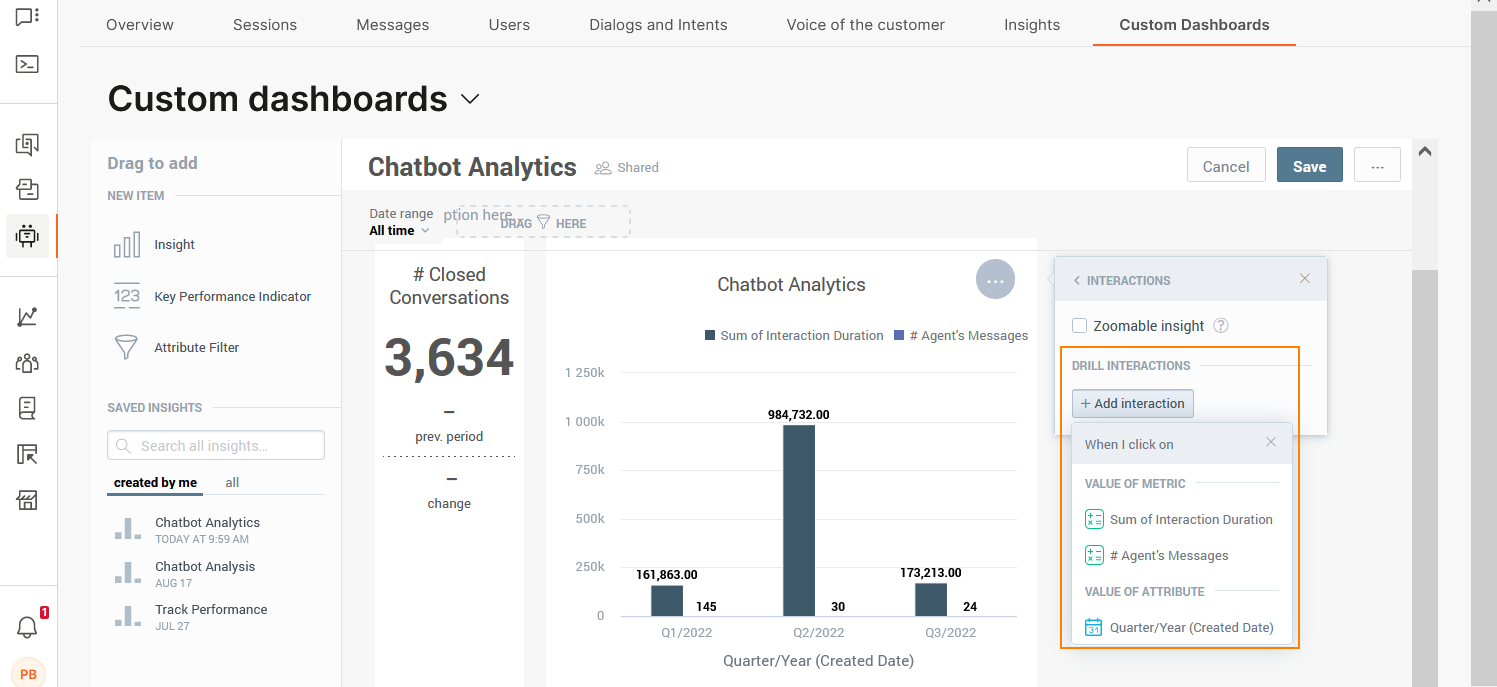
Configure drilling [#configure-drilling-drill-into-data]
-
Click the insight to view the menu options.
-
Click Interactions > Drill Interactions > Add interaction.
-
Choose the data item for which you want to drill.
-
In the I want to section, choose whether you want to drill into the insight, another dashboard, or a URL.
- Drill into dashboard: Choose an existing dashboard. You can choose dashboards that you created or those that are shared with you.
- Drill into insight: Choose the insight to which you want to drill. You can choose insights that you created or those that are shared with you.
- Drill into URL: Either choose an existing URL or create a custom URL.
-
Click Save.
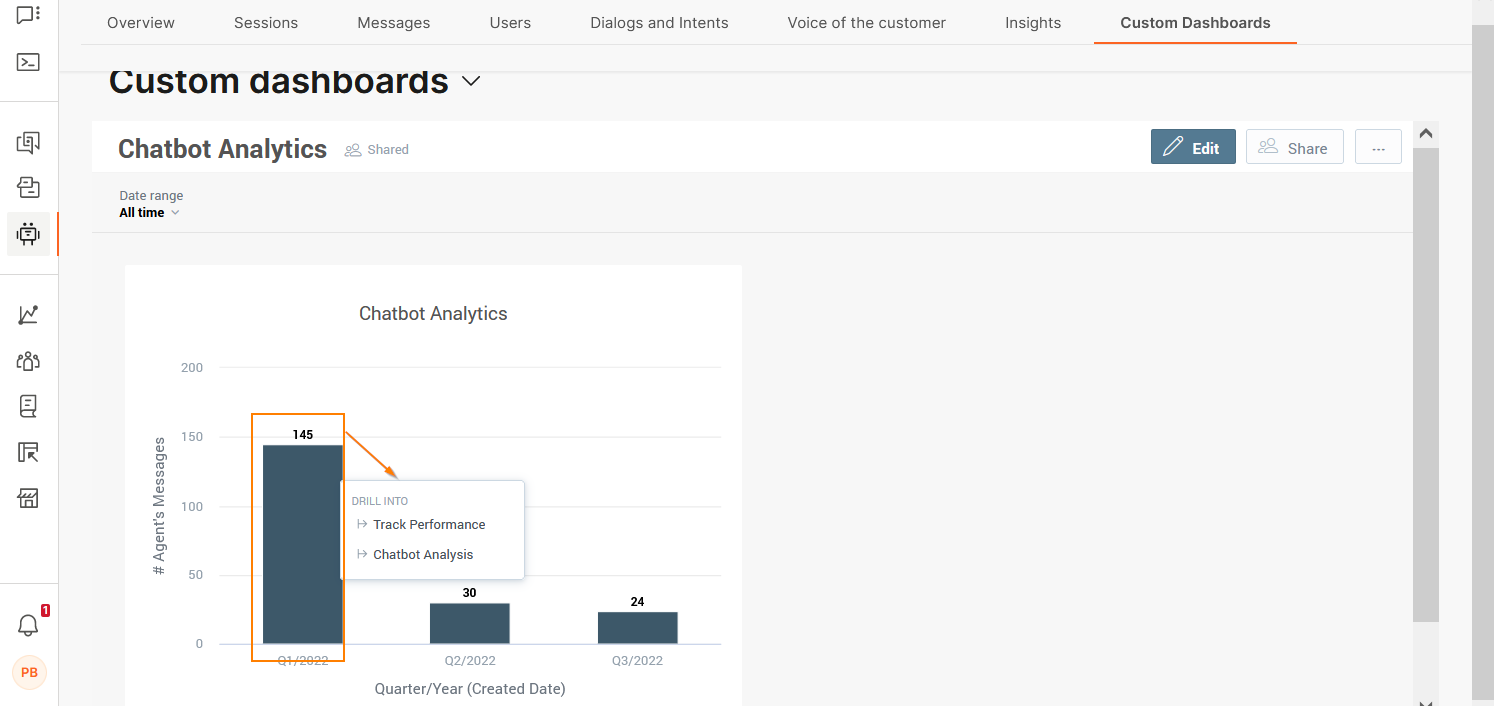
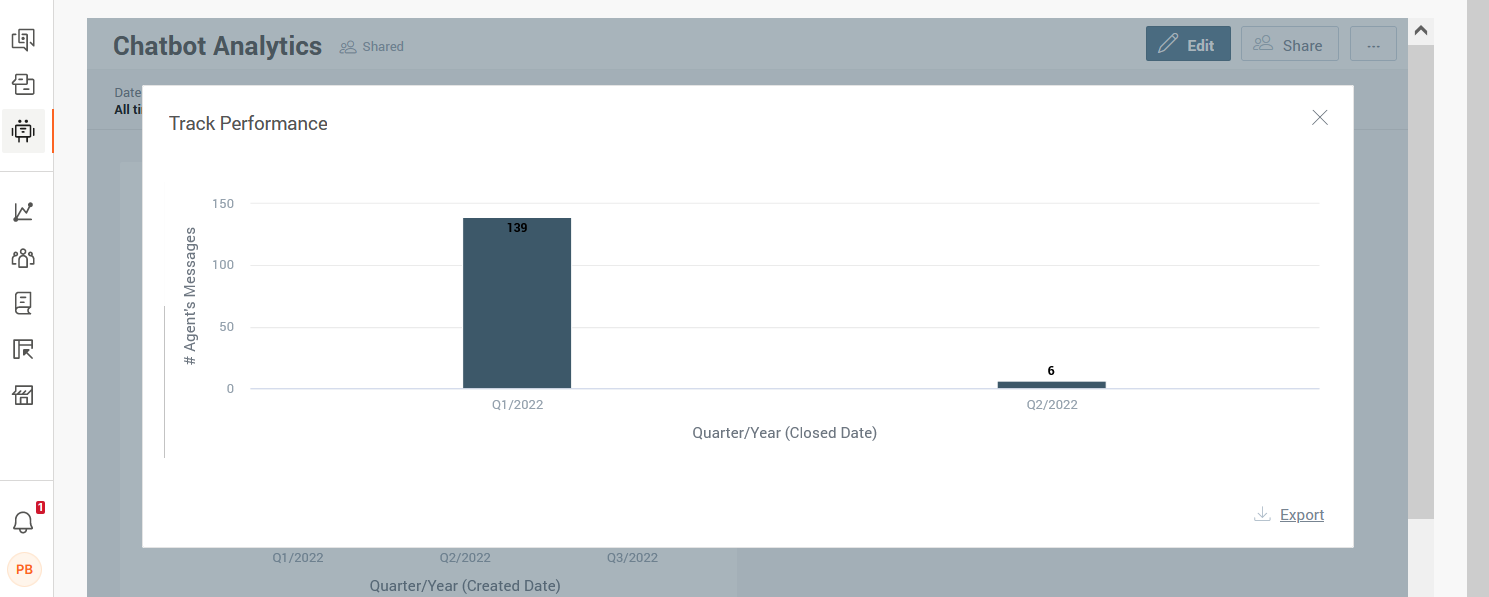
View the results [#view-the-results-drill-into-data]
- On the dashboard, go to the insight.
- Click the item into which you want to drill. Then, click an item in either the Drill down or Drill into sections.
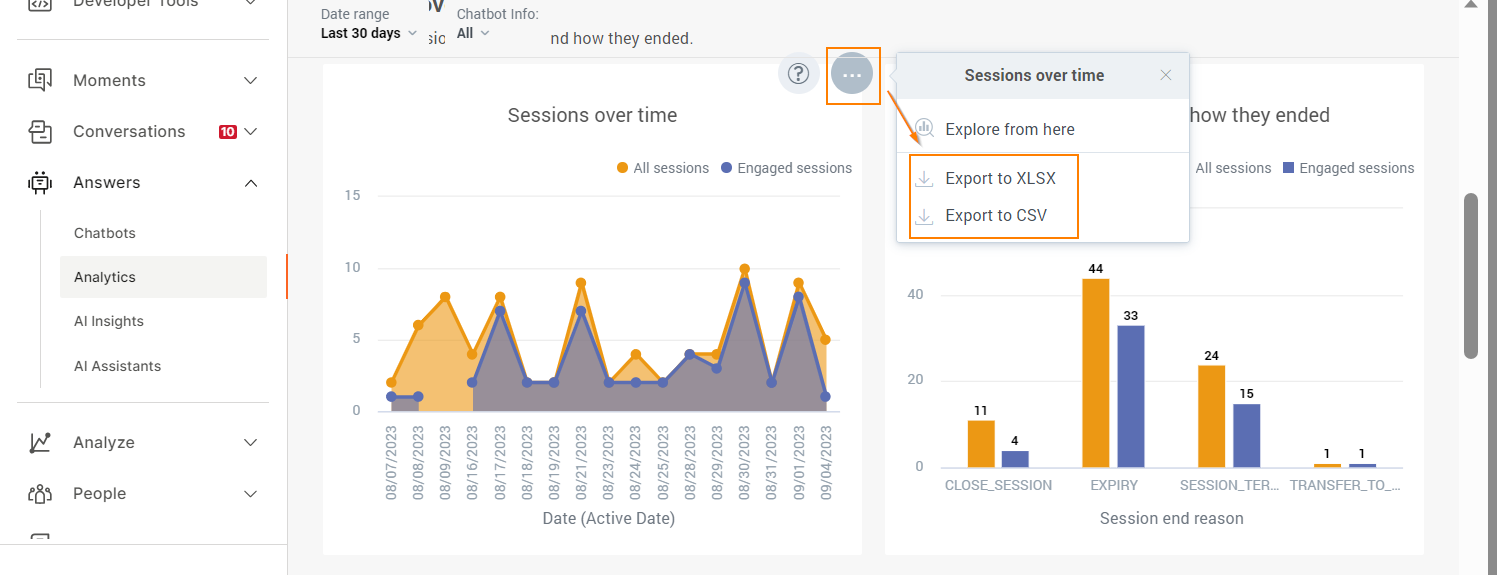
Export a dashboard
To export a dashboard, click the three dots against the dashboard and choose one of the following file formats:
- .csv
- .xls
The dashboard is downloaded as a static file.
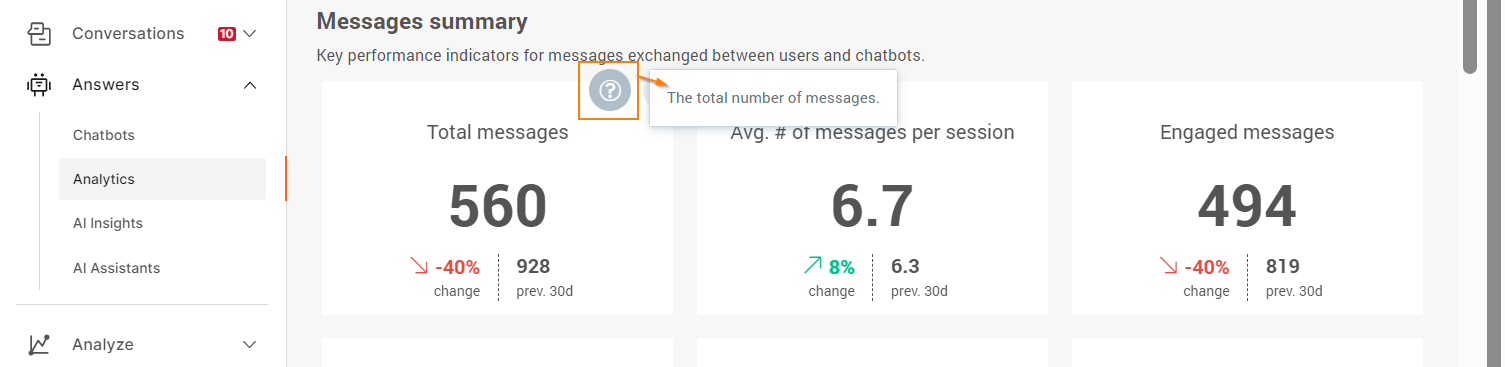
View details about the graph
Hover over the question mark icon for more information about the graph.
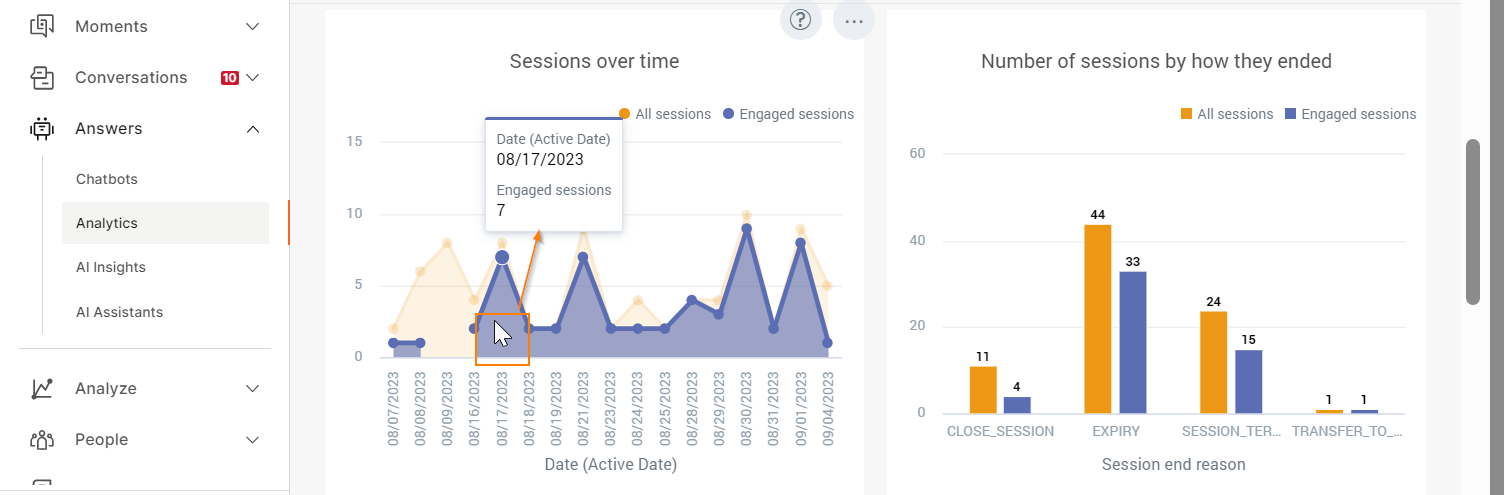
View details about a data point
Hover over a data point in the graph for more information.
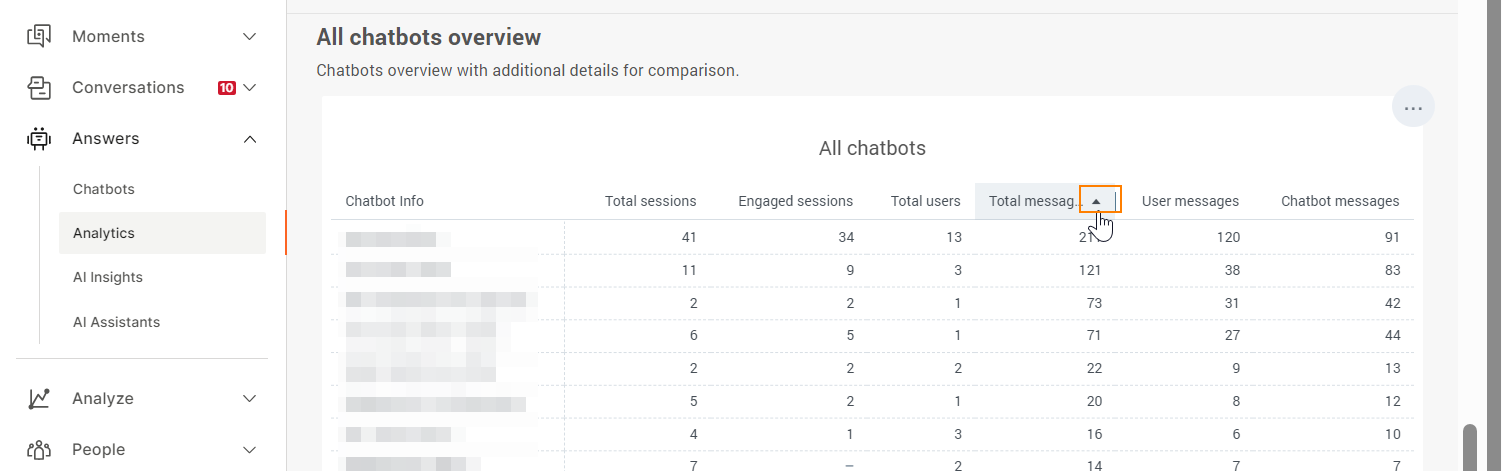
Sort data in tables
To sort the data in a table, click the relevant header.
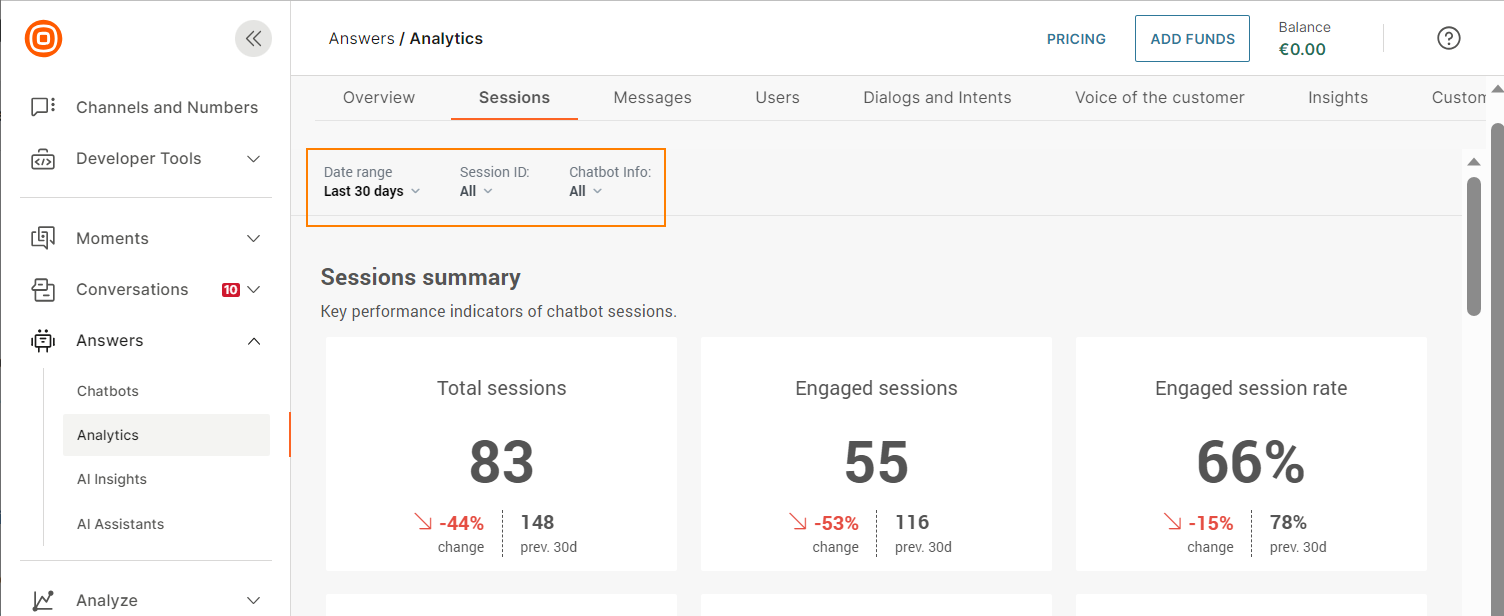
Filter data
Use the filters at the top of a page to filter all data on the page based on the selected criteria. Each page might have a different set of filters.
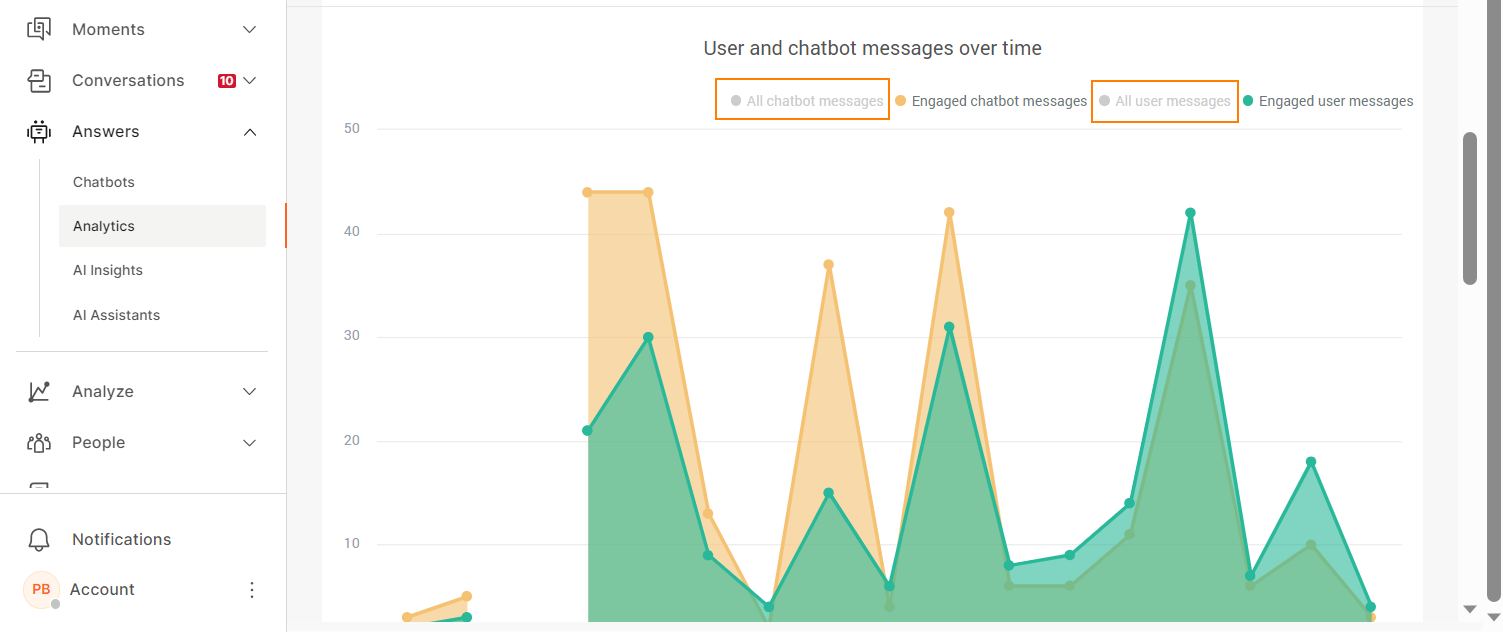
Show or hide data in graph
You can hide data so that only the required data is visible in the graph.
In the key at the top of the graph, click the items that you want to hide. Similarly, to add this data back, click the items again.
Example: The following graph contains All chatbot messages, Engaged chatbot messages, All user messages, and Engaged user messages. Click the All chatbot messages and All user messages in the graph key so that only Engaged chatbot messages and Engaged user messages graphs are visible.
You can also hover over a data point in the graph to highlight the entire set of data. Example: In the following image, hovering over a data point in the Engaged sessions graph highlights only that graph.