


SMS marketing benchmarks: Key stats by industry
Find out how your SMS marketing ranks against the averages for your industry and how you can move the needle to achieve better results.

As our 2026 Messaging Trends research shows, SMS continues to be the most used channel for marketing in 2026. And its use is growing – the report shows a global year-on-year increase of 34% in the use of SMS for marketing use cases.
The open rates and exceptional engagement metrics see it outperform other messaging channels for every use case where it is important for recipients to see messages quickly.
But what does a success actually look like for an SMS marketing campaign? In this blog we summarize the keys stats that marketers should be tracking and most importantly – the benchmarks for each industry. Our research shows that the stats can vary significantly across verticals, so it is important to be comparing apples with apples.
Our aim is to help marketers evaluate their own campaign performance and provide a basis for continual improvement and refinement of their messaging strategy.
Key SMS marketing performance metrics
These are the SMS stats that you need to be tracking to gauge the effectiveness of your campaigns and to quickly identify any problems that require attention.
Delivery rate
This measures the percentage of messages successfully delivered to recipients’ phones.
The formula is (Delivered messages ÷ Sent messages) × 100
BENCHMARK
You should aim at getting your delivery rate as close to 100% as possible. Anything above 95% would be considered good for SMS marketing campaigns,
While you have no control over subscribers that change their phone number or don’t switch their phones on, by following message content best practice and following compliance rules, you should be able to keep your delivery rate high.
w
Some of the factors that can impact SMS delivery rates for marketing campaigns include:
- Invalid phone numbers: If your contact list includes numbers that are no longer active or are incorrectly formatted then messages can’t be delivered to those people.
- Message content triggering spam filters: Overuse of capital letters, suspicious links, or the use of certain keywords can trigger the automated filters that carries use.
- Unsupported message content: Messages that contain special characters or unsupported media like images or even emojis can cause them to be blocked. In some countries URLS are not allowed in B2C SMS messages.
- Recipients’ unavailable: If a recipient’s phone is turned off – maybe because they are on a flight, or they don’t have network coverage in their work location then a message might not be delivered immediately or at all.
- Compliance issues: Failing to follow local legislation with regard to opt-in and message content can lead to blocklisting and poor delivery rates.
- Technical issues: Network congestion or other failures in telecom networks can cause temporary delivery issues.
- Inappropriate sender number for use case: Short codes are often a better option for marketing messages as long codes (standard phone numbers) may be throttled or blocked for high volume deployments.
Open rate
While open rate is a well understood metric in email marketing, when it comes to SMS it needs to be calculated slightly differently. This is because SMS platforms don’t track opens the same way emails do as with SMS there is no pixel or embedded image to confirm that a message has been viewed.
However, SMS open rates can be accurately inferred based on other recipient activity and on empirical data related to smartphone usage.
Multiple studies have arrived at a figure of 98% for SMS open rate but note that this applies to messages that have actually been delivered (this means that theoretically you could have an open rate higher than your delivery rate).
If there was a way of reliably tracking which recipients had opened a message then the formula would be SMS Open Rate (%) = (Number of Opens ÷ Number of Delivered Messages) × 100
BENCHMARK
Looking at the available research most sources quote an average SMS open rate of between 90% and 98% (Forbes).
There does not appear to be a major difference in rates between industries.
As for immediacy, studies show that 90% of recipients open a text message within three minutes of receiving it (Validity).
With email open rates for marketing messages generally between 20% and 28%, SMS ensures a far higher chance of messages being seen.
w
However, open rate should always be used in conjunction with engagement metrics to establish the success of campaigns. Just because people are opening your promotional messages doesn’t mean that they are converting.
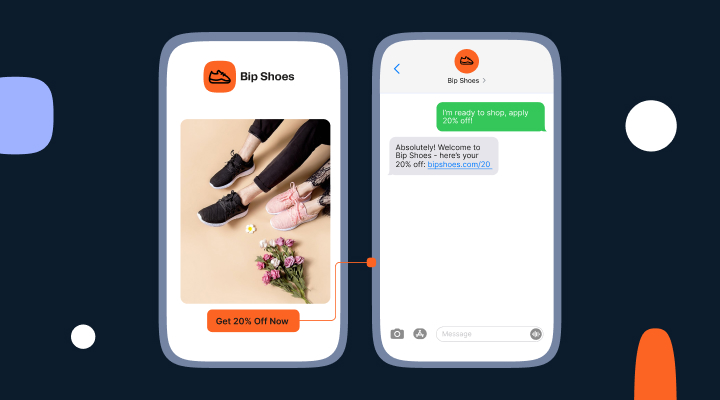
Conversion rate
Conversion rate measures how many recipients completed a desired action like clicking on a link or making a purchase.
Formula: (Conversions ÷ Clicks) × 100
BENCHMARK
The average SMS marketing conversion rate in 2024-2025 ranges between 21% and 40%, according to industry analysts.
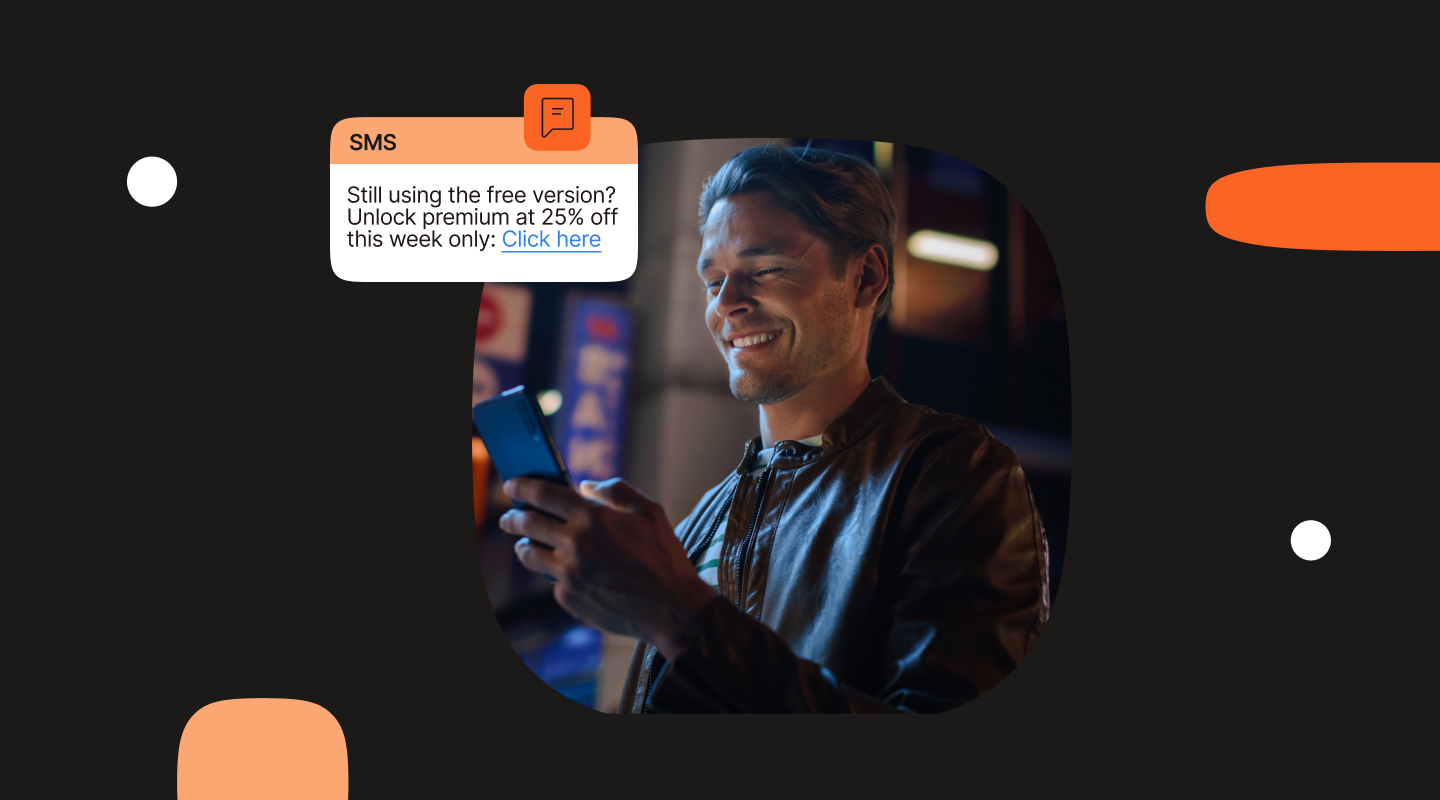
Technology sees the highest performance at 31-40%, while Consumer Services and E-commerce/Retail typically achieve 11-20%.
Commercial Services, Construction, Education, and Manufacturing businesses typically see SMS conversion rates between 21-30%
Finance and Healthcare, both highly regulated sectors, consistently achieve conversion rates higher than 20%.
w
Why does SMS marketing performance differ between industries?
The success of SMS marketing varies widely across industries due to a mix of audience behavior, regulatory constraints, and how well the channel fits the business model. Here are some key reasons for those differences:
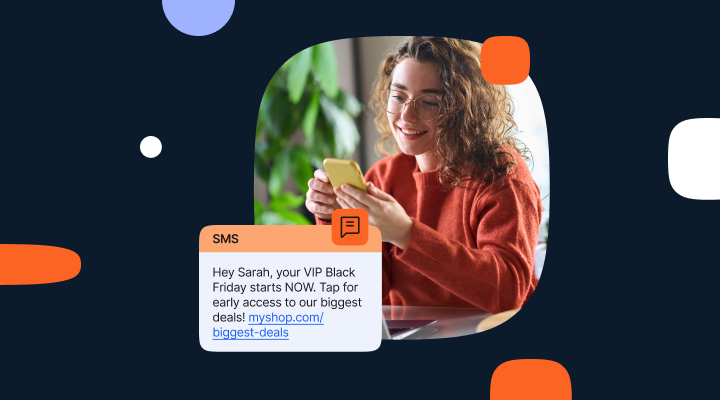
Customer expectations and engagement: In industries like retail or hospitality, customers often expect real-time deals, booking confirmations, or flash sales -making SMS a natural fit. In contrast, sectors like legal or B2B services may not benefit as much from such immediacy.
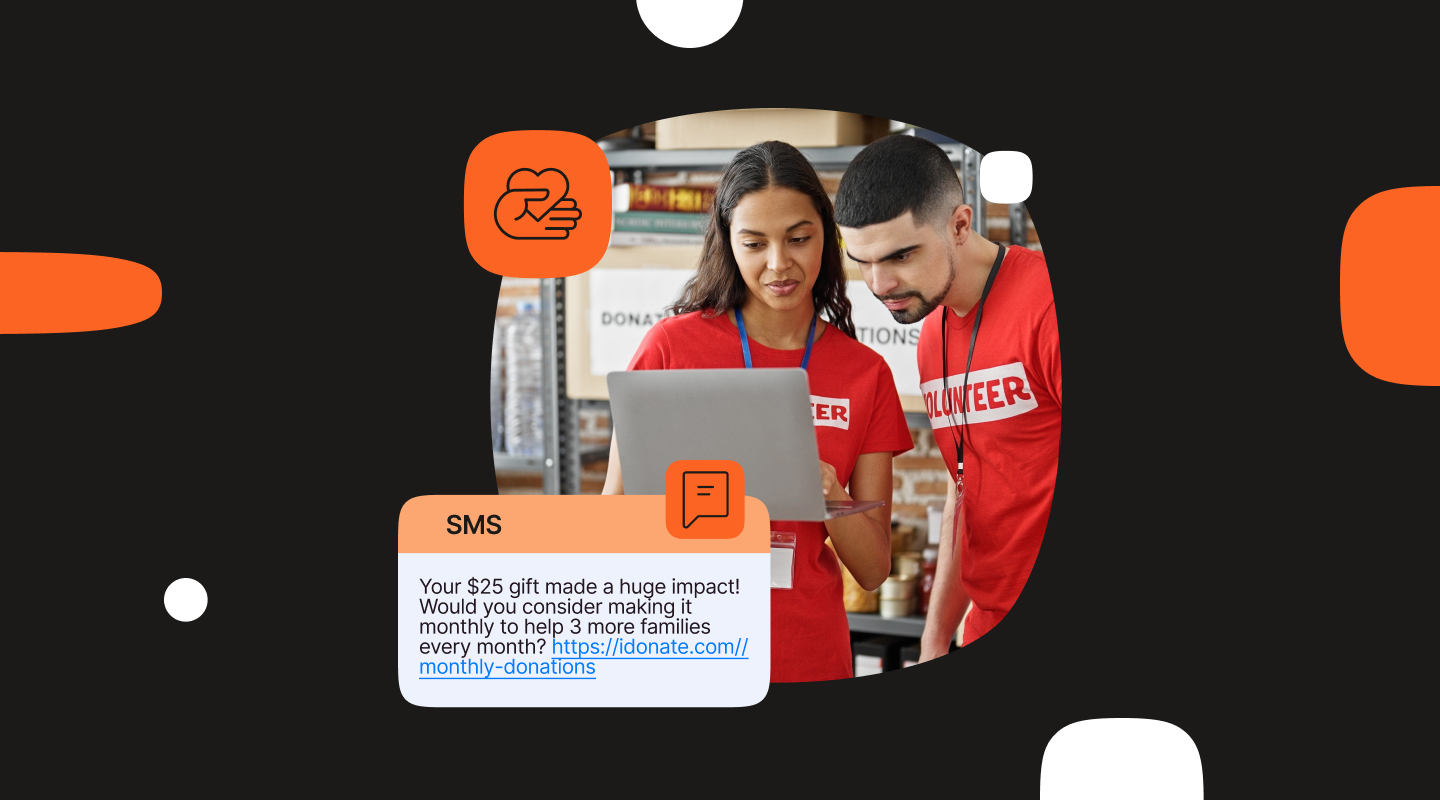
Message relevance and timing: Industries that can deliver time-sensitive or highly relevant content—like healthcare (appointment reminders), finance (transaction alerts), or education (schedule changes)—tend to see higher engagement rates.
Regulatory and privacy constraints: Financial and healthcare sectors must comply with strict data protection laws (like GDPR or HIPAA), which can limit how freely they use SMS. Retailers, on the other hand, often have more flexibility in promotional messaging.
Audience demographics: Younger, mobile-savvy audiences (common in fashion or entertainment) are more responsive to SMS. Industries targeting older or less tech-oriented demographics may see lower engagement.
Integration with broader marketing strategy: SMS works best when it complements other channels. Industries that integrate SMS with email, social media, or loyalty programs—like e-commerce or travel—tend to see better results.
Other SMS marketing benchmarks
Going a step further, there are a number of other SMS stats that it is beneficial to track. These include:
Click-Through Rate (CTR)
This tracks how many recipients clicked on a link in your SMS.
The formula is (Clicks ÷ Delivered messages) × 100
Benchmark: A CTR above 20% is considered excellent for SMS marketing messages.
Unsubscribe Rate
This is one that you will want to keep as low as possible as it indicates how many people opted out after receiving a particular message.
Return on Investment (ROI)
Loved by upper management and the company accountant, ROI measures the financial return of your campaign.
The formula is (Revenue from SMS – Cost of SMS) ÷ Cost of SMS × 100
Benchmark: ROI differs greatly across industries and depending on the type of message. A retail brand running flash sales might aim for a 3,000%+ ROI while a B2B company using SMS for lead nurturing might be happy with 500%, especially if the sales cycle is longer.
In conclusion
The latest SMS marketing benchmarks demonstrate that text messaging remains one of the most effective digital marketing channels, with unparalleled open rates and strong conversion performance across all industries.
What can make the difference between average and top-performing campaigns is strategic segmentation and conversational approaches. Organizations that move beyond transactional messaging to implement sophisticated, conversational strategies stand to achieve results that significantly exceed industry benchmarks.